Headlines indicate 2.4% y/y HICP inflation in the euro area hitting consensus. Instantaneous inflation per Eeckhout (T=12,a=4) is 0.4%.
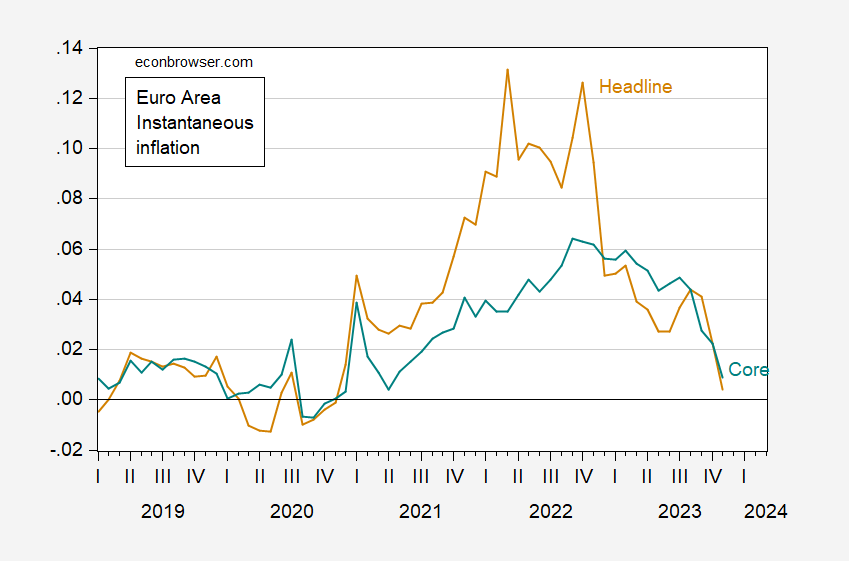
Figure 1: Euro area instantaneous inflation headline (tan), core (teal). Seasonally adjusted using X13 (log transform; X11 ARIMA), calculated using Eeckhout (2023) definition, T=12, a=4. Source: Eurostat via FRED, author’s calculation.
The wide gap between headline and core indicates the role of energy in Euro area inflation. A comparison of core inflation series suggests a larger possible role for demand side factors in the US vs. Euro area, through August 2022. But it could also suggest a role for supply side factors to the extent that nonenergy nonfood prices could be driven by labor market tightness, or nonfood nonfuel import prices (i.e., supply chain disruptions).
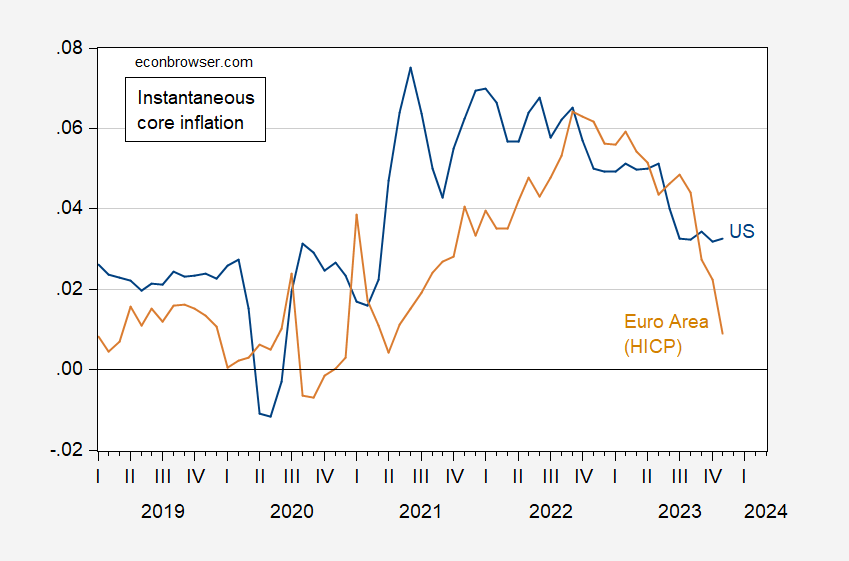
Figure 2: Euro area instantaneous core inflation headline (tan), US CPI core inflation (blue). Seasonally adjusted using X13 (log transform; X11 ARIMA), calculated using Eeckhout (2023) definition, T=12, a=4. Source: Eurostat via FRED, author’s calculation.
Figure 2 suggests that core inflation is more persistent in the US than in the Euro area. That can be taken as bad news; or it could be taken as indicating that the Euro area is more rapidly moving to recession.
Note that HICP and CPI for the US move in somewhat different ways, but not completely different. To show this, I graph q/q CPI and HICP inflation rates in Figure 3.
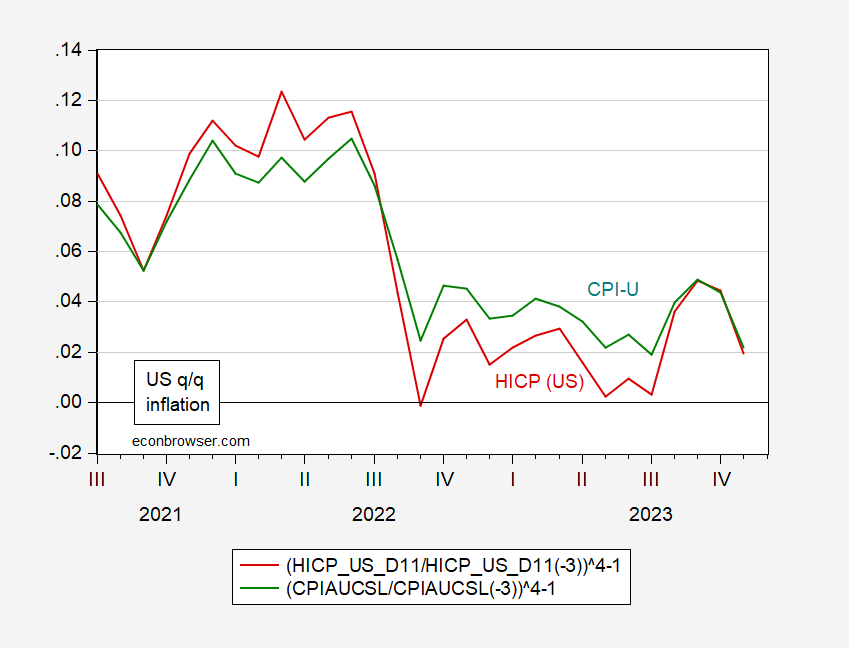
Figure 3: US HICP q/q inflation (red). Seasonally adjusted using X13 (log transform; X11 ARIMA), and US CPI q/q inflation, both at annual rates. Source: Eurostat via FRED, author’s calculation.
Source link