Biden is visiting Wisconsin. it’s interesting to see how the state economy is doing, and what the Evers administration is forecasting (based primarily on national macro developments).
First employment:
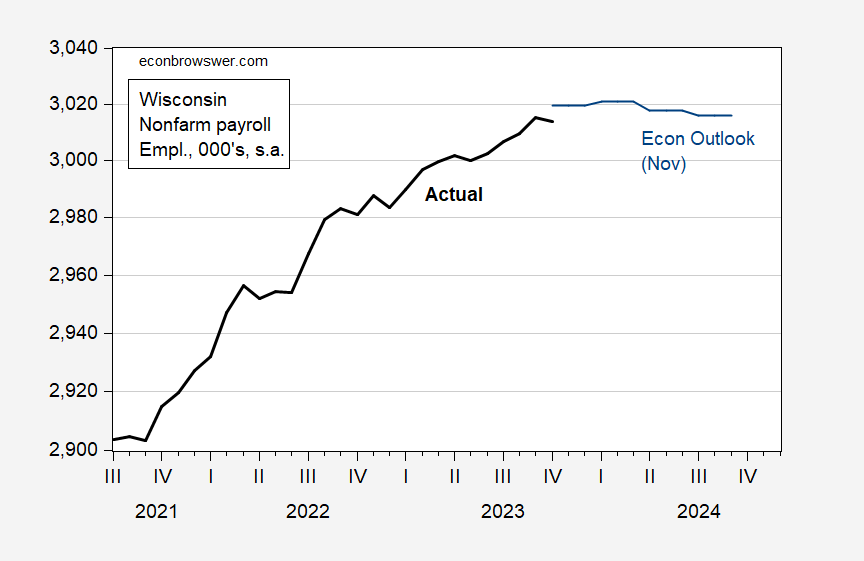
Figure 1: Wisconsin nonfarm payroll employment (bold black), and Wisconsin Economic Forecast (blue), both in 000’s, s.a. Source: BLS and Wisconsin Dept of Revenue Nov. Forecast.
Nonfarm payroll employment growth is forecasted to stall out in the later part of 2024, likely due to a slowing national economy marked into the SP Global (formerly IHS Markit) forecast. The slowdown is
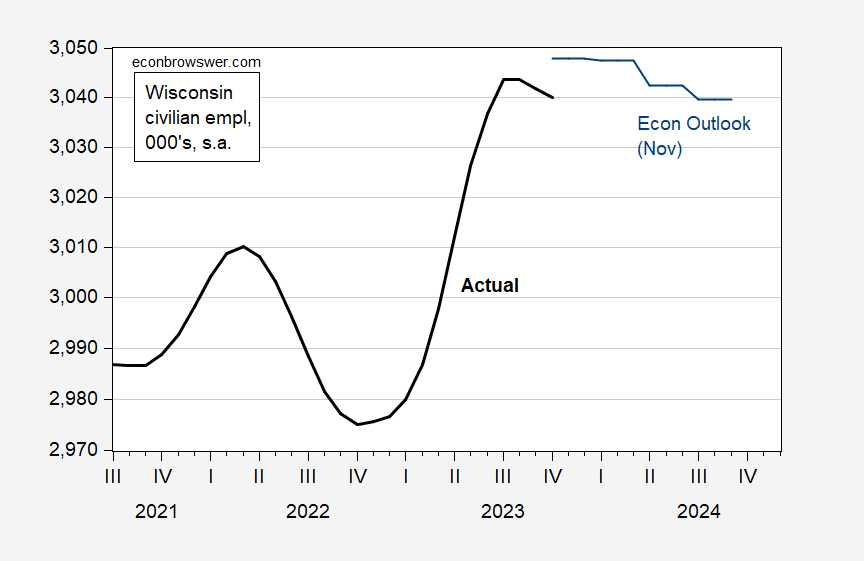
Figure 2: Wisconsin civilian employment (bold black), and Wisconsin Economic Forecast (blue), both in 000’s, s.a. Source: BLS and Wisconsin Dept of Revenue Nov. Forecast.
Notice that the civilian employment series exhibits a lot more variability. It’s important to recall that the state level civilian employment estimates are calculated using a model that differs from the approach used at the national level. This is necessitated by the smaller samples associated with states. In other words, I‘d be very wary of using state level employment series based on the household survey.
That being said, the forecast indicates essentially zero employment growth in 2024Q1.
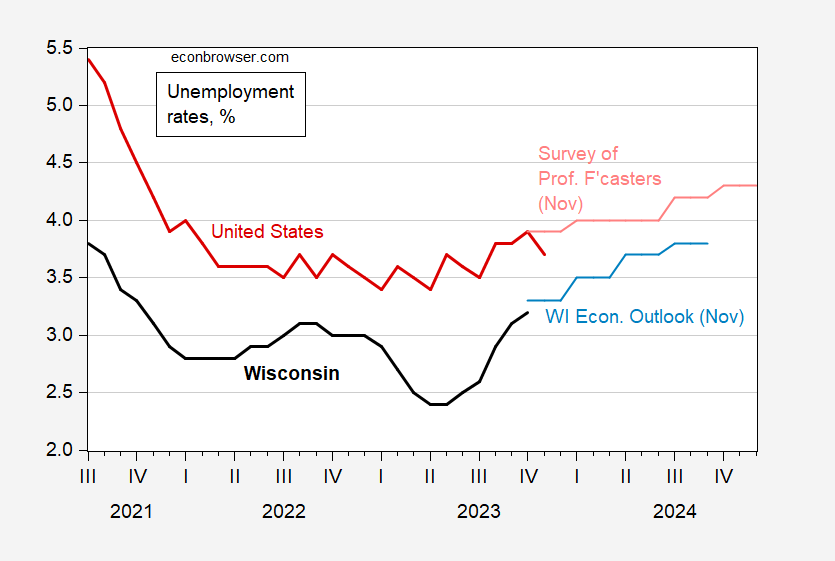
The employment and labor force errors are probably correlated in a way that the unemployment rates are less volatile. Here’s a comparison of Wisconsin and national unemployment rates. On average Wisconsin has 0.9 percentage point lower unemployment than the national average (consider that a state level fixed effect). Nonetheless, the Department of Revenue’s forecast shows faster increase in unemployment than the Survey of Professional Forecasters’ national rate (in principle, to see how the Wisconsin rate is being driven, one should look at the S&P Global (formerly IHS-Markit) forecast).
Figure 3: Wisconsin unemployment rate (bold black), and Wisconsin Economic Forecast (blue), national unemployment rate (bold red), and Survey of Professional Forecaster’s forecast, both in %, s.a. Source: BLS and Wisconsin Dept of Revenue Nov. Forecast. Philadelphia Fed (November)
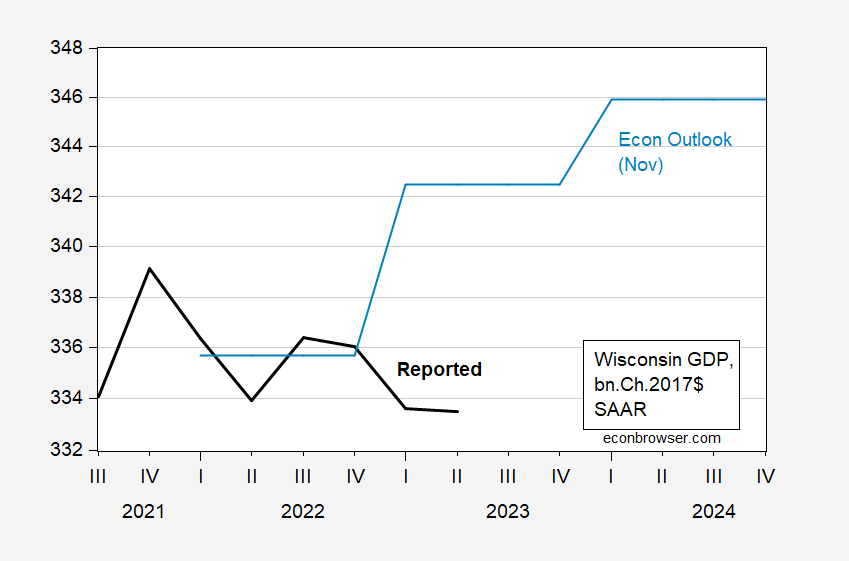
As for non-labor market indicators, GDP is forecasted to rise, mirroring the national level forecasts of continued growth.
Figure 4: Wisconsin GDP (bold black), and Wisconsin Economic Forecast (blue), both in bn.Ch.2017$ SAAR. Source: BEA, and Wisconsin Dept of Revenue Nov. Forecast.
The latest released Wisconsin GDP (advance, first time in 2017$) is down, and 2023Q1 was revised downward in direction vs. previous vintage. Definitely revisions can change the trajectory of state level GDP.
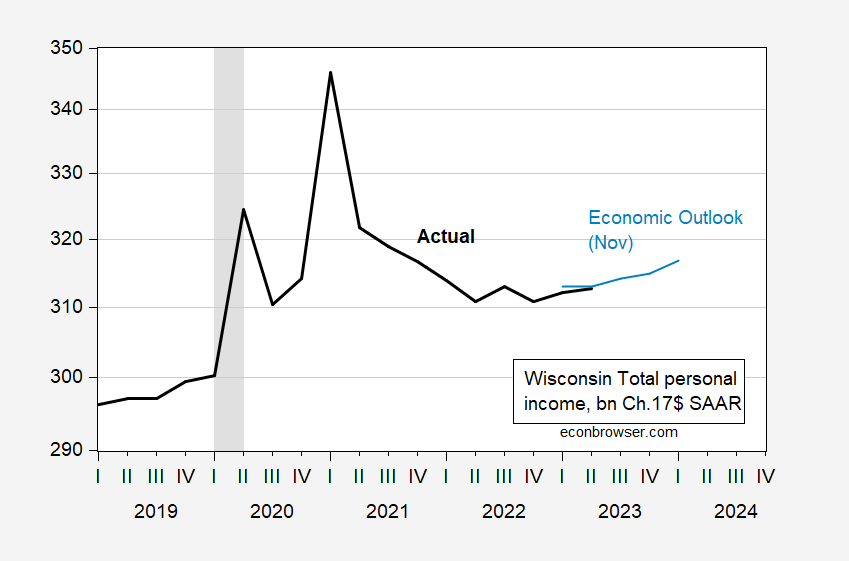
Inflation adjusted total personal income did rise in Q1-Q2, in contrast to GDP.
Figure 5: Wisconsin total personal income (bold black), and Wisconsin Economic Forecast (blue), both in bn.Ch.2017$ SAAR, 2019-2024. Deflated using nationwide PCE deflator, and Survey of Professional Forecasters forecasted nationwaide PCE deflator. NBER defined peak-to-trough recession dates shaded gray. Source: BEA, Wisconsin Dept of Revenue Nov. Forecast, Philadelphia Fed, NBER, and author’s calculations.
It’s important to note that this is total personal income (not disposable), or the NBER BCDC target series personal income ex-current transfers.
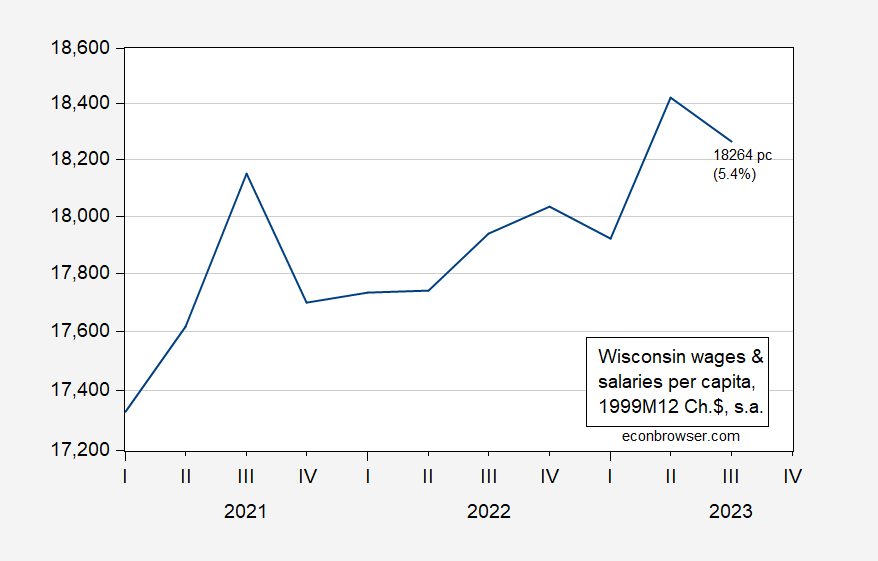
Note that recently, the Joint Economic Committee (Republicans) have been tabulating the dollar increase in living costs per consumer unit (kind of a household) since January 2021, in their “state inflation tracker”, which I take as an attempt to connect with the average person (but ends up being totally confusing). I prefer to tabulate these sort of things on a per capita basis, in percent. Here’s my take – total wages and salaries per capita adjusted by the chained CPI.
Figure 6: Wisconsin total wages and salaries per capita, deflated by national CPI chained, in 1999M12$ SAAR. Total wages and salaries (FRED series WIWTOT) divided by Wisconsin resident population in July (FRED series WIPOP) via quadratic interpolation. Source: BEA, Census via FRED, BLS, and author’s calculations.
Real total compensation (not income) has outpaced living costs by 5.4% cumulative, since 2021Q1 in Wisconsin.
More information on November employment tomorrow from DWD, from BLS on Friday.
Source link

