As of mid-December, it’s hard to see the recession (even with this morning’s downward revision of GDP growth to 4.9%) so there’s a lot of triumphalism about how the oft-predicted recession of 2023. We only have monthly data through November at best, so perhaps it’s still a little premature to declare victory for 2023 — but only a little. For 2024, these concurrent indicators are of little help.
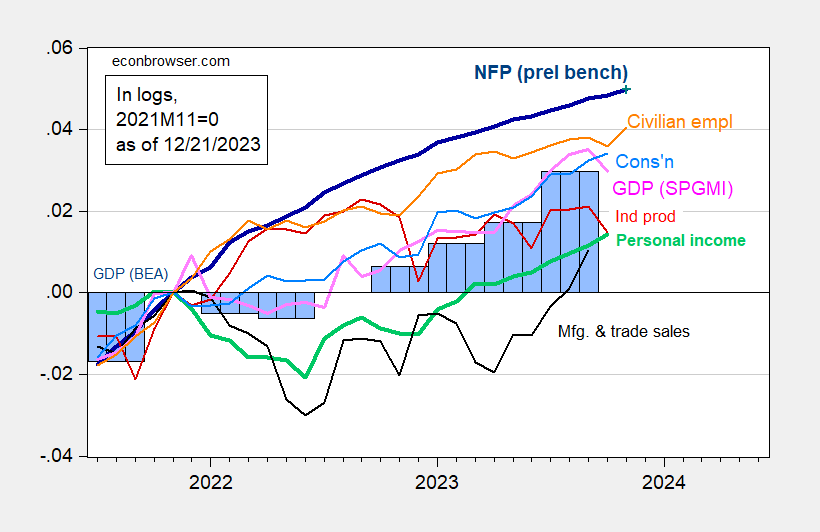
First, the series NBER Business Cycle Dating Committee focuses on, along with SPGMI monthly GDP.
Figure 1: Nonfarm Payroll employment incorporating preliminary benchmark (bold dark blue), implied level using Bloomberg consensus as of 12/4 (blue +), civilian employment (orange), industrial production (red), personal income excluding transfers in Ch.2017$ (bold green), manufacturing and trade sales in Ch.2017$ (black), consumption in Ch.2017$ (light blue), and monthly GDP in Ch.2017$ (pink), GDP, 3rd release (blue bars), all log normalized to 2021M11=0. Source: BLS via FRED, BLS preliminary benchmark, Federal Reserve, BEA 2023Q3 2nd release incorporating comprehensive revisions, S&P Global/IHS Markit (nee Macroeconomic Advisers, IHS Markit) (12/1/2023 release), and author’s calculations.
Not shown in Figure 1 is the Atlanta Fed’s GDPNow (of 12/19), which indicates 2.7% q/q SAAR growth for 2023Q4.
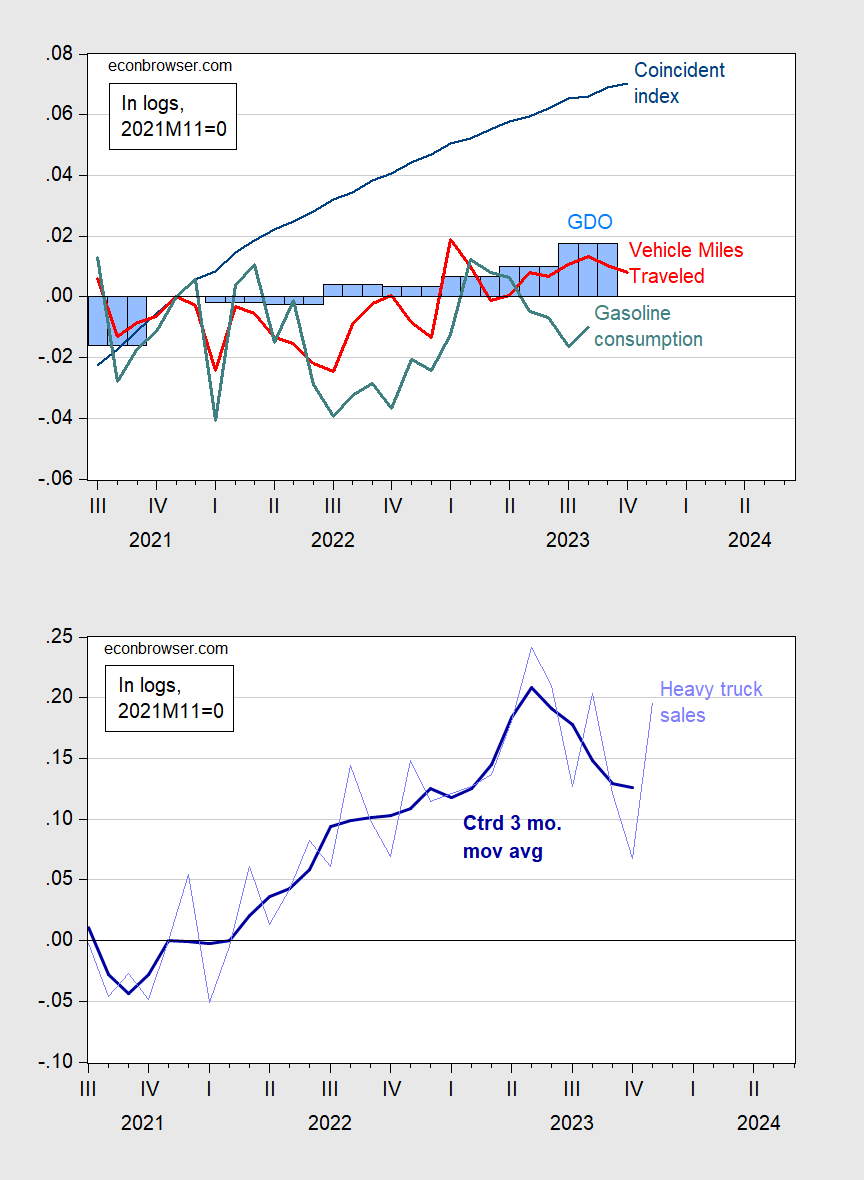
Here are other popular measures: Philadelphia Fed coincident index, GDO, and Heavy Truck Sales. I’ve also added some idiosyncratic measures, like Vehicle Miles Traveled, and Gasoline Consumption.
Figure 2: Top Panel Coincident Index (blue), Vehicle Miles Traveled (red), Gasoline Consumption (teal), GDO in 2017$ (blue bars), all in logs, 2021M11=0; gasoline consumption seasonally adjusted using X13 (ARIMA X11). Bottom Panel Heavy Truck Sales (light blue), centered 3 month moving average (bold dark blue), both in logs, 2021M11=0. Source: Philadelphia Fed, DoT, Census, BEA GDP 3rd release via FRED, EIA, and author’s calculations.
The coincident index is showing far faster growth than GDO, reflecting its basis in primarily labor market measures, Both travel indicators – VMT and gasoline consumption – seem particularly unreliable given work from home, and for gasoline consumption, the increasing prevalence of EV’s. Heavy Truck Sales are still up relative to 2021M11, but it’s remarkable that sales are fast declining (after a peak in April 2023), a harbinger of slowdown.
These are indicators that are lagging behind by as much as three months ago. Here are some weekly indicators of economic activity (tracking y/y GDP growth) as of a few days ago, released today.
Figure 3: Lewis-Mertens-Stock Weekly Economic Index (blue), and Baumeister-Leiva-Leon-Sims Weekly Economic Conditions Index for US plus 2% trend (green), all y/y growth rate in %. Source: NY Fed via FRED, WECI, accessed 12/21, and author’s calculations.
The WECI+2% thru 12/16 is 1.73%, while the WEI reading is 2.36%. The latter is interpretable as a y/y quarter growth of 2.36% if the 2.36% reading were to persist for an entire quarter. The Baumeister et al. reading of -0.27% is interpreted as a 0.27% growth rate below the long term trend growth rate. Average growth of US GDP over the 2000-19 period is about 2%, so this implies a 1.73% growth rate for the year ending 12/16.
Hence, we have some mixed signals for y/y growth for economic data coming in through mid-December.
Recall the WEI relies on correlations in ten series available at the weekly frequency (e.g., unemployment claims, fuel sales, retail sales), while the WECI relies on a mixed frequency dynamic factor model.
Source link

