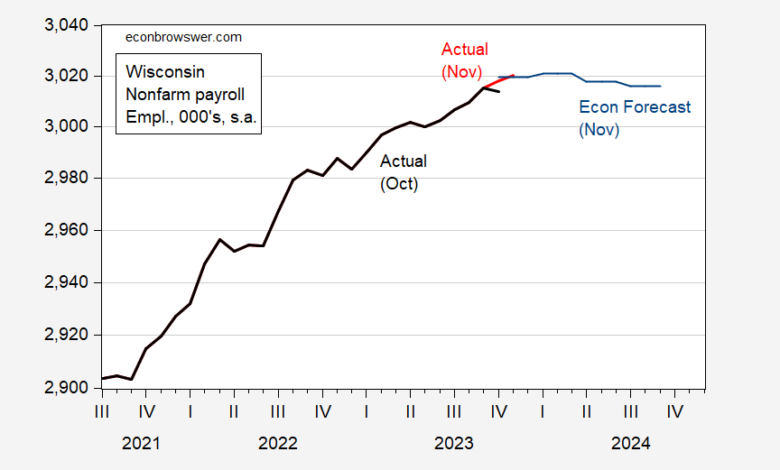
Yesterday, the Wisconsin macro outlook was reviewed in the context of the November Economic Forecast released by the DoR. Today, we can update the picture, using the newly released employment numbers.
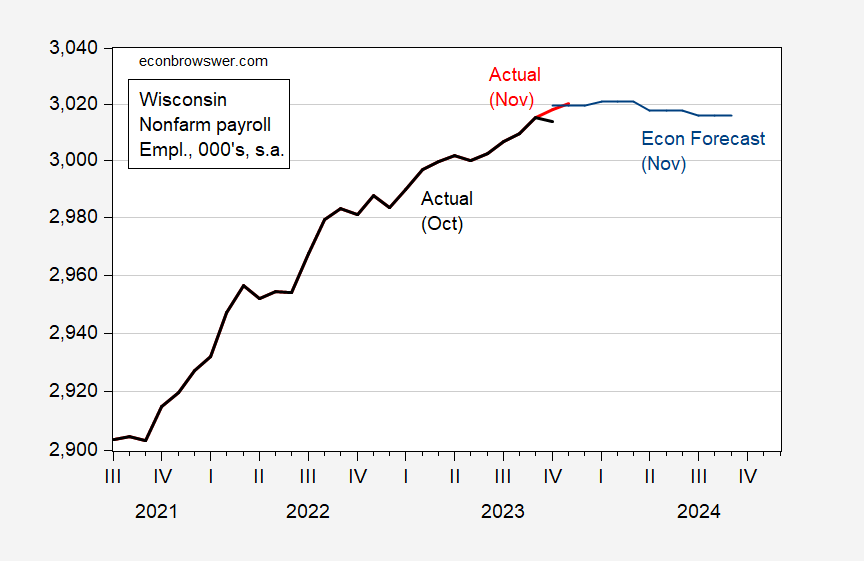
First, the October decline in nonfarm payroll employment is erased, and November’s number is up, hitting the forecast.
Figure 1: Wisconsin nonfarm payroll employment from October release (bold black), from November release (red), and Wisconsin Economic Forecast (blue), both in 000’s, s.a. Source: BLS, DWD, and Wisconsin Dept of Revenue Nov. Forecast.
Nonfarm payroll employment growth has been decelerating over time (as shown in Figure 1 with a log scale, the decreasing slope means slowing growth). Forecasted employment will stall out in the later part of 2024, likely due to a slowing national economy marked into the SP Global (formerly IHS Markit) forecast.
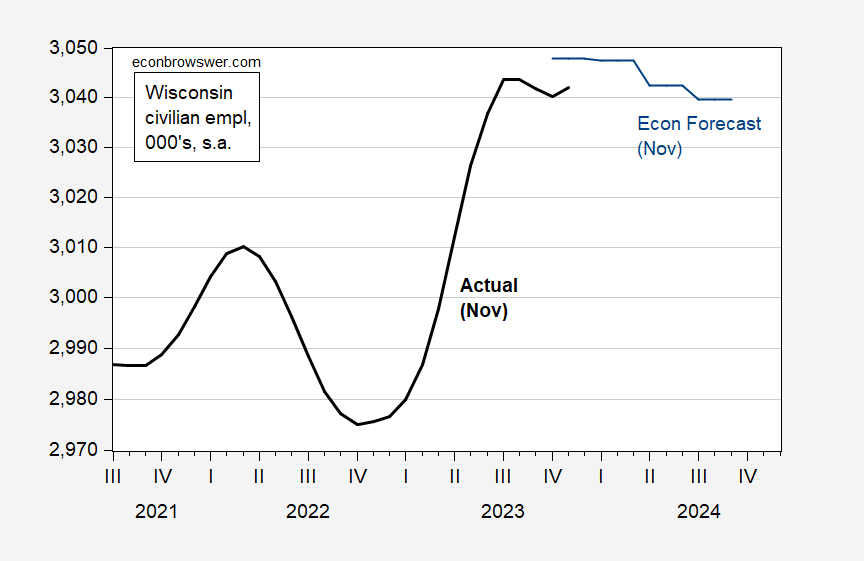
The slowdown in September-October also showed up in the civilian employment series, but reversed course in November. Of course, one should never put too much faith in one month’s observation.
Figure 2: Wisconsin civilian employment (bold black), and Wisconsin Economic Forecast (blue), both in 000’s, s.a. Source: BLS and Wisconsin Dept of Revenue Nov. Forecast.
Notice that the civilian employment series exhibits a lot more variability. It’s important to recall that the state level civilian employment estimates are calculated using a model that differs from the approach used at the national level. This is necessitated by the smaller samples associated with states. In other words, I‘d be very wary of using state level employment series based on the household survey.
That being said, the forecast indicates essentially zero employment growth in 2024Q1.
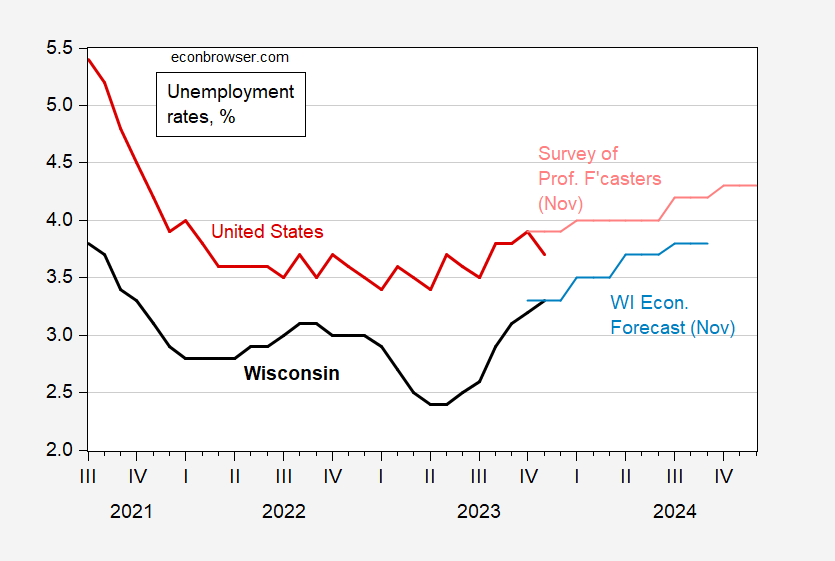
The employment and labor force errors are probably correlated in a way that the unemployment rates are less volatile. Here’s a comparison of Wisconsin and national unemployment rates. On average Wisconsin has 0.9 percentage point lower unemployment than the national average (consider that a state level fixed effect). Nonetheless, the Department of Revenue’s forecast shows faster increase in unemployment than the Survey of Professional Forecasters’ national rate (in principle, to see how the Wisconsin rate is being driven, one should look at the S&P Global (formerly IHS-Markit) forecast).
Figure 3: Wisconsin unemployment rate from November release (bold black), and Wisconsin Economic Forecast (blue), national unemployment rate (bold red), and Survey of Professional Forecaster’s forecast, both in %, s.a. Source: BLS , DWD, and Wisconsin Dept of Revenue Nov. Forecast. Philadelphia Fed (November).
The Wisconsin unemployment rose to forecasted levels, while the national rate is below the November SPF level.
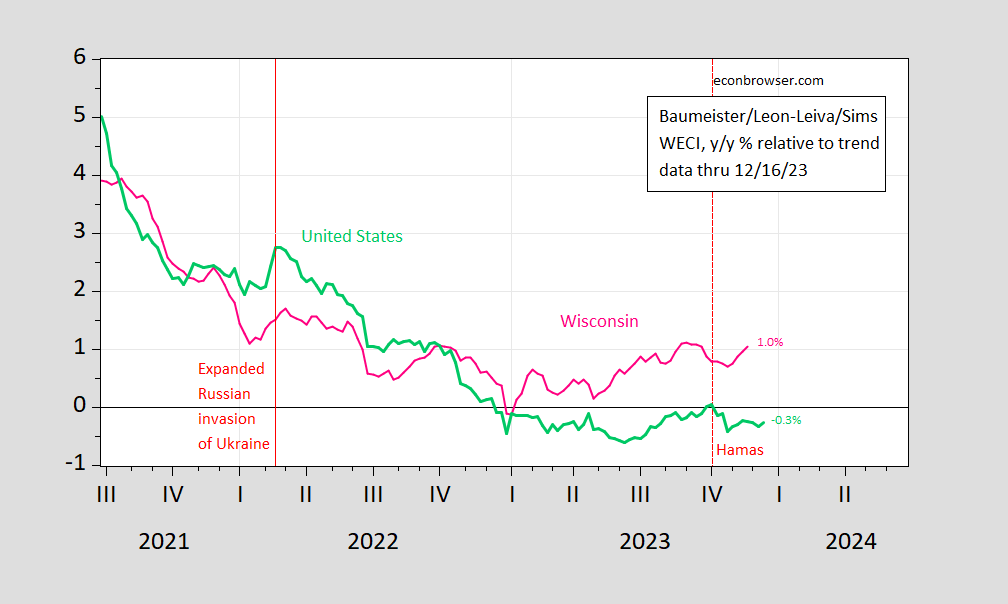
The employment data is backward looking, to early-mid November. More up to date reading on the Wisconsin economy is provided by the Baumeister/Leon-Leiva/Sims Weekly Economic Conditions Index:
Figure 4: Baumeister-Leiva-Leon-Sims Weekly Economic Conditions Index for US (green), for Wisconsin (pink), all y/y growth rate in % deviation from trend.. Source: WECI, accessed 12/21, and author’s calculations.
Source link

