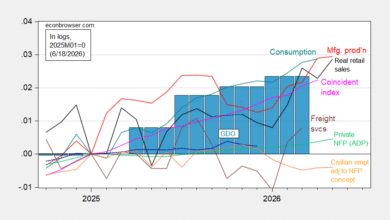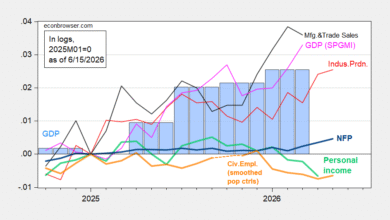
NFP growth surprises on the upside (see discussion here), but combined with downward revisions in October and November, we’re just at about the consensus level. Here’s the picture of some key indicators followed by the NBER Business Cycle Dating Committee, plus monthly GDP and GDPNow.
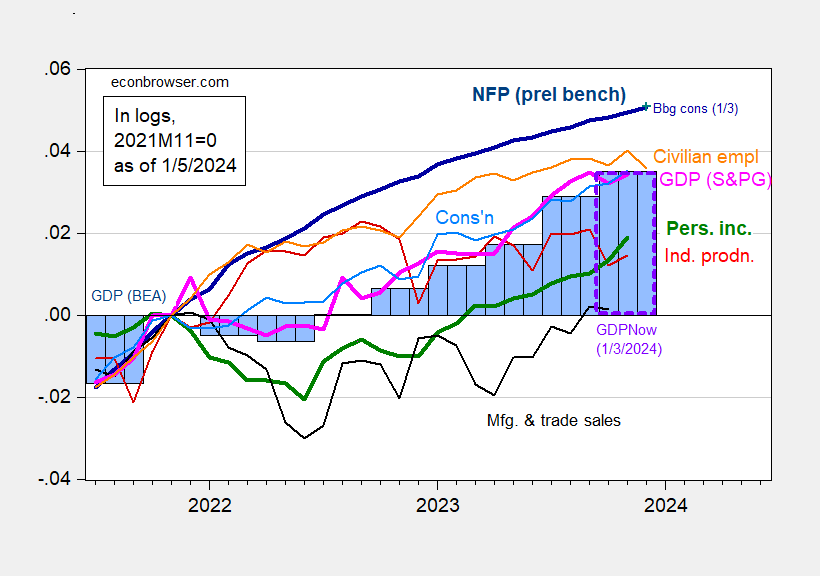
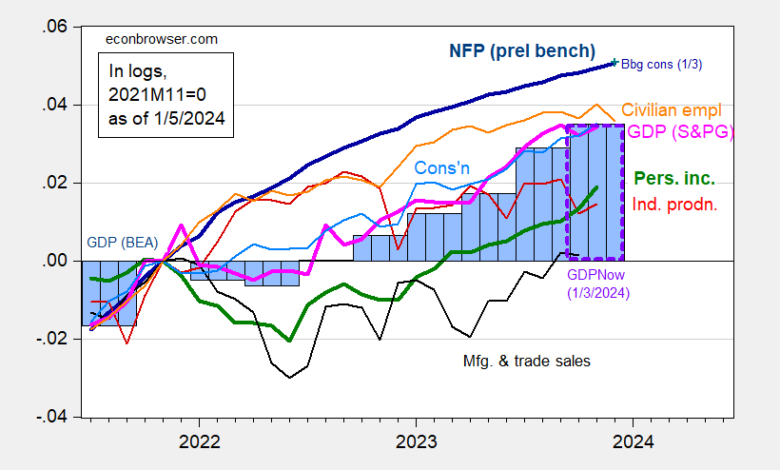
Figure 1: Nonfarm Payroll employment incorporating preliminary benchmark (bold dark blue), implied level using Bloomberg consensus as of 1/3 (blue +), civilian employment (orange), industrial production (red), personal income excluding transfers in Ch.2017$ (bold green), manufacturing and trade sales in Ch.2017$ (black), consumption in Ch.2017$ (light blue), and monthly GDP in Ch.2017$ (pink), GDP, 2nd release (blue bars), and GDPNow for 2023Q4 as of 1/3 (lilac box), all log normalized to 2021M11=0. Source: BLS via FRED, BLS preliminary benchmark, Federal Reserve, BEA 2023Q3 2nd release incorporating comprehensive revisions, S&P Global/IHS Markit (nee Macroeconomic Advisers, IHS Markit) (1/3/2024 release), Atlanta Fed, and author’s calculations.
Bloomberg consensus is for +163K NFP growth on 1/3, and +170 just before the release. Actual was +216.
While civilian employment went down 0.4% m/m (5.1% annualized), it’s important to realize that in tracking the business cycle, the household survey measure provides almost no information. Now there is some casual evidence that downturns in the household survey measure precede those in the establishment survey measure. In the last 4 recessions, the household series has preceded the establishment series twice using real time data (the other two times, they declined at the same time). On the other hand, using the household measure as an indicator, we would’ve said a recession was coming in May, and in October, of 2023.
Today’s NY Fed nowcast for Q4 is 2.54% q/q AR (compared with 2.5% for GDPNow of 1/3). St. Louis Fed News index at 1.78%.
Source link