Industrial production and manufacturing production both beat Bloomberg consensus (+0.1% vs 0%). Here’s the picture of some key indicators followed by the NBER Business Cycle Dating Committee, plus monthly GDP and GDPNow (latter up today to 2.4% vs. 2.2% SAAR on 1/10).
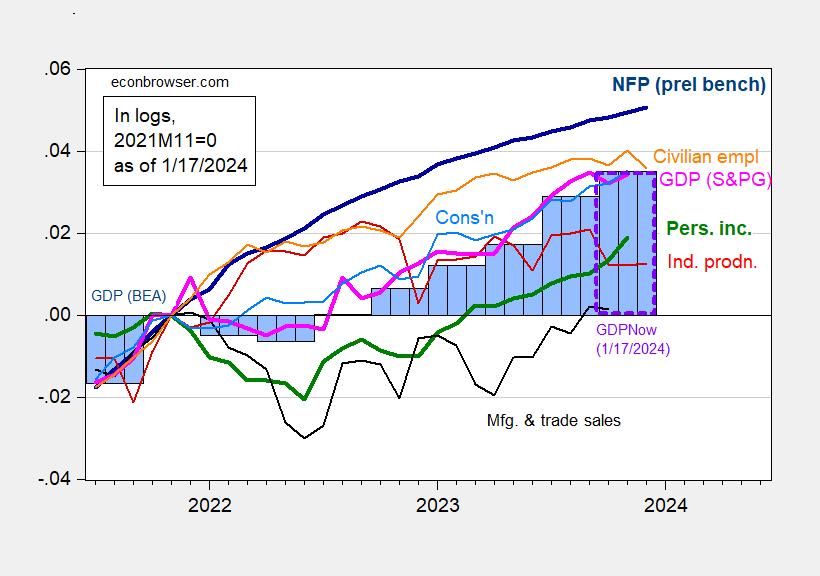
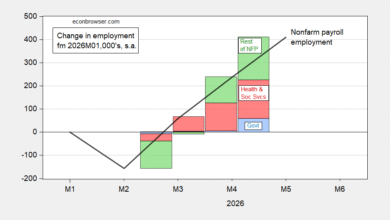
Figure 1: Nonfarm Payroll employment incorporating preliminary benchmark (bold dark blue), implied level using Bloomberg consensus as of 1/3 (blue +), civilian employment (orange), industrial production (red), personal income excluding transfers in Ch.2017$ (bold green), manufacturing and trade sales in Ch.2017$ (black), consumption in Ch.2017$ (light blue), and monthly GDP in Ch.2017$ (pink), GDP, 2nd release (blue bars), and GDPNow for 2023Q4 as of 1/17 (lilac box), all log normalized to 2021M11=0. Source: BLS via FRED, BLS preliminary benchmark, Federal Reserve, BEA 2023Q3 2nd release incorporating comprehensive revisions, S&P Global/IHS Markit (nee Macroeconomic Advisers, IHS Markit) (1/3/2024 release), Atlanta Fed, and author’s calculations.
The evolution of GDPNow estimates highlights how incoming news has continued to push back any likely date for recession start. While GDPNow was raised by about 0.2 ppts, GS raised its tracking estimate by 0.3 ppts, to 1.8%. Their estimate of final sales growth was also raised to 2.5% (GDPNow’s estimate of final demand is 2.9%).
Source: Atlanta Fed, accessed 1/17/2024.
Other data coming in today surprised on the upside, with m/m nominal retail sales at +0.6% vs. +0.4% consensus. Below is a a time series plot of deflated retail sales and retail and food service sales.
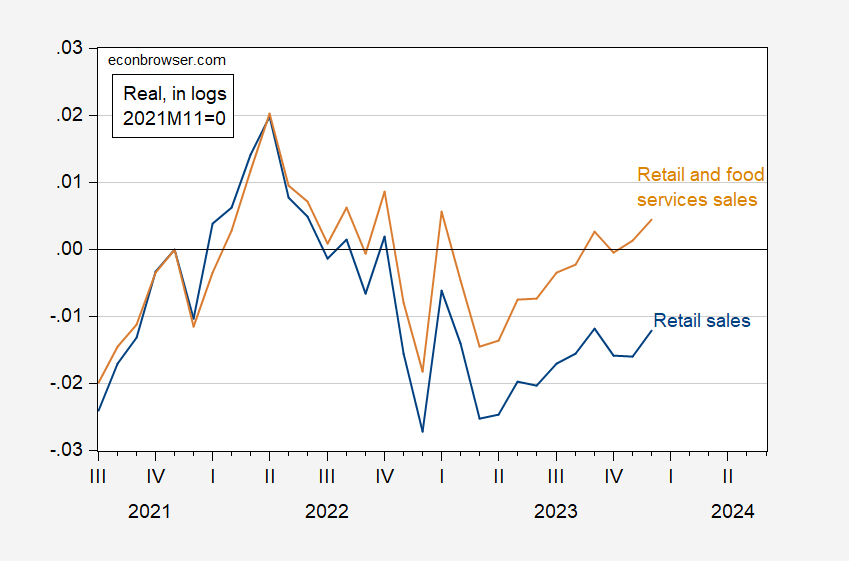
Figure 2: Real retail sales (blue), and retail and food services sales (tan), in logs 2021M11=0. Deflated using chained CPI, adjusted by X13 by author. Source: Census and BLS via FRED, and author’s calculations.
Source link