First time teaching undergrad macro in three years, so I thought time to revise the syllabus (Econ 442) to account for new issues (compare against Fall 2001).
First, climate change and macro implications.
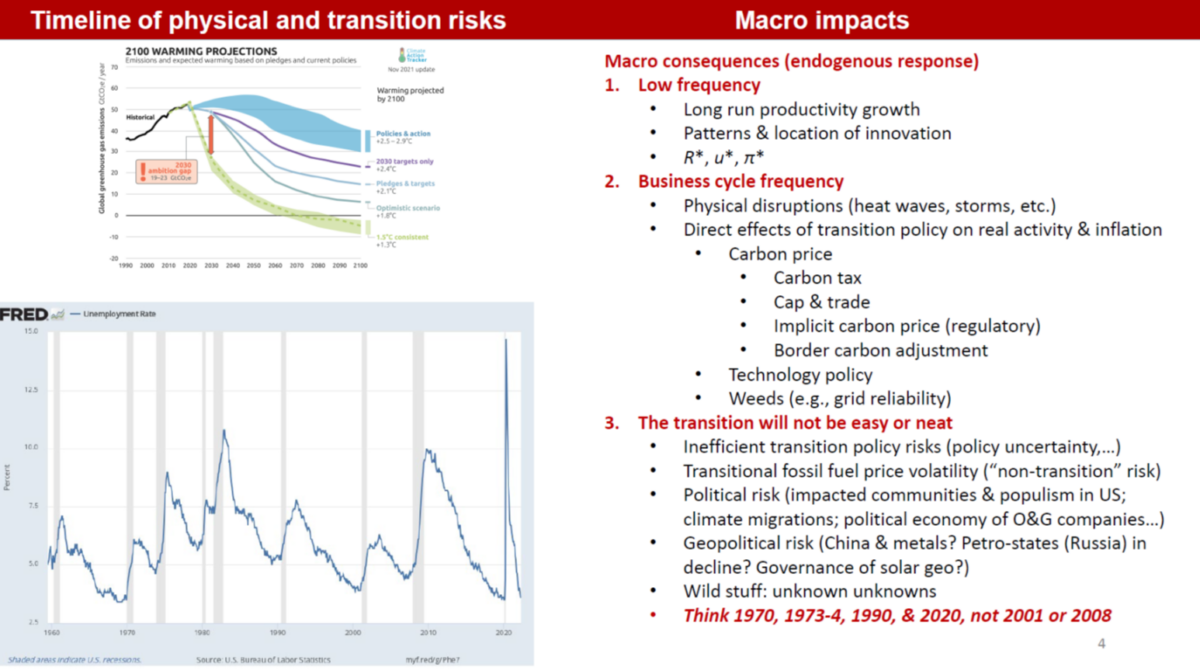
Source: Stock (2022).
Will be focusing on climate shocks complicating macro stabilization (consider hurricanes, droughts, heat waves, disaster insurance crises), consequences of reliance on fossil fuels, implications of carbon taxes and cap & trade.
Is the Phillips Curve still relevant?
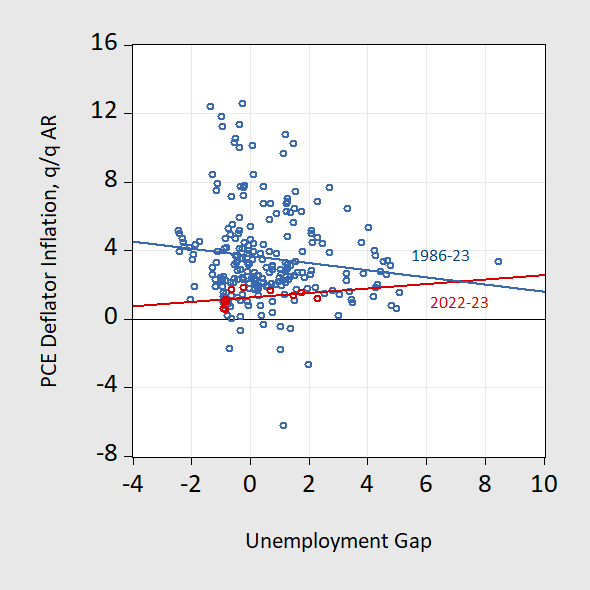
Figure 1: PCE deflator q/q Annualized inflation against unemployment gap, lagged one quarter, 1986-2023Q3. Bivariate regression line for 1986-2023 (blue), for 2021-2023 (red). Unemployment gap calculated as unemployment rate minus noncyclical unemployment rate from CBO. Source: BEA, BLS, CBO via FRED, and author’s calculations.
The rapid runup and decline is taken by some as an indictment of the conventional Phillips curve approach. Figure 1 is suggestive. However, even a basic textbook version of the Phillips curve incorporates more than 2 variables…
Is it government debt: why have real yields risen?
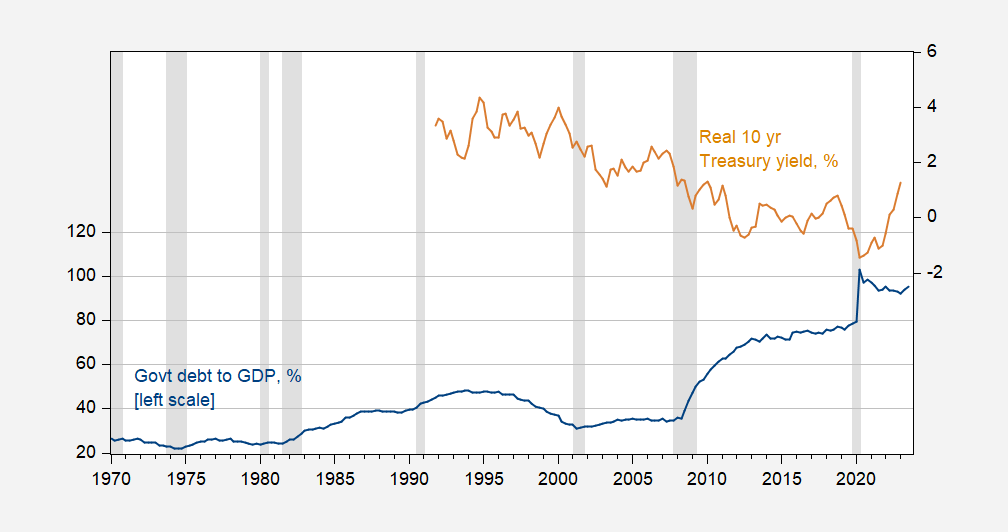
Figure 2: Government debt held by public divided by GDP, % (blue, left scale), and real 10 year Treasury yield, % (tan, right scale). Real yield is nominal 10 year subtracting SPF expected 10 year inflation rate. NBER defined peak-to-trough recession dates shaded gray. Source: Treasury, BEA, via FRED, Philadelphia Fed, NBER, and author’s calculations.
The switch from declining debt-to-GDP to rising in 2001, accompanied by fall real yields posed a challenge to conventional wisdom. Did the 2020 jump in debt-to-GDP result in a long-standing break in that association.
Will the dollar remain a safe-haven currency (and what does it imply for interest rates)?
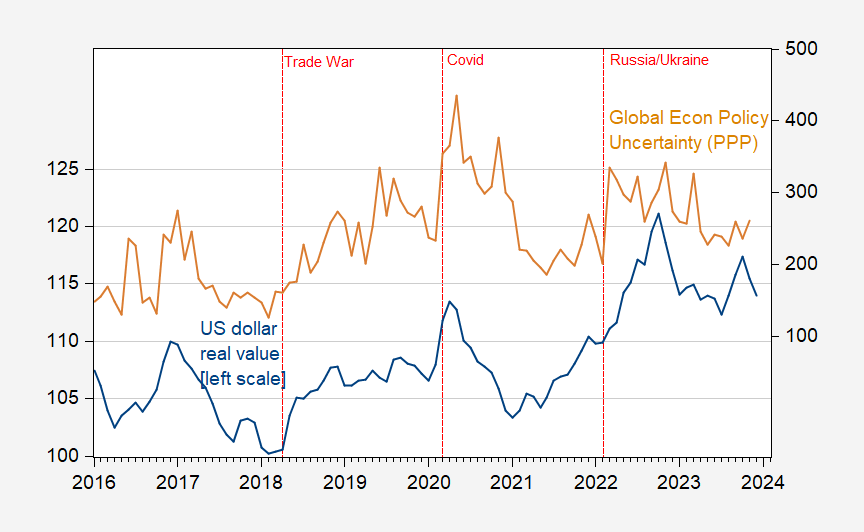
Figure 3: US dollar (broad) real value (blue, left scale), and Global Economic Policy Uncertainty, PPP weighted (tan, right scale). Real exchange rate spliced at 2006M01 – goods weights pre-2006, goods and services weights thereafter. Source: Federal Reserve Board, policyuncertainty.com, and author’s calculations.
In times of uncertainty, the dollar rises in value. This is even true when when shock emanates from the US (think Covid and bleach; and in September 2008).
And what does reserve currency status (related but different from being a safe have currency) imply for continuation of this trend in the US Net International Investment Position?
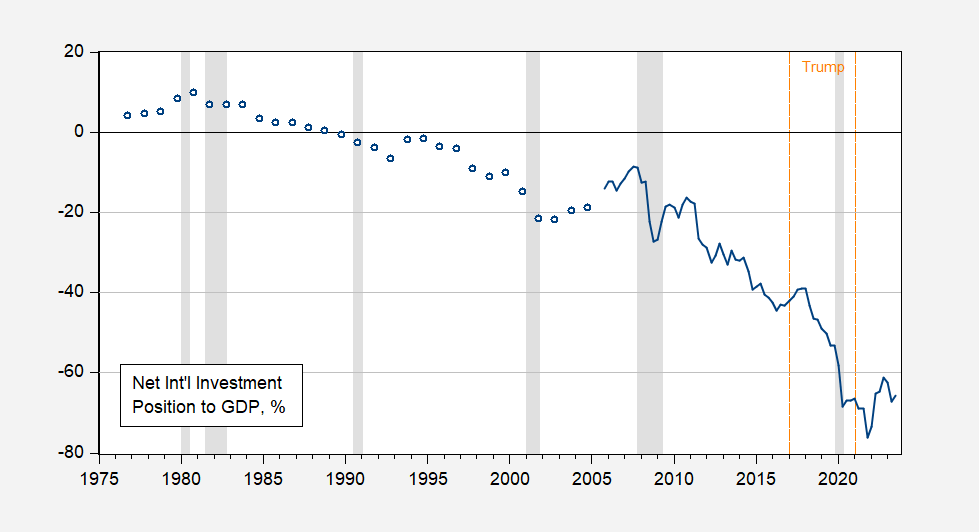
Figure 4: Net international investment of the United States (ex-derivatives) as a share of US GDP, %. NBER defined peak-to-trough recession date shaded gray. Source: BEA, NBER and author’s calculations.
Interestingly, the US became increasingly a net debtor (by about 30 ppts of GDP) over the Trump administration. Winning!
The textbook for the class is Olivier Blanchard’s Macroeconomics. I know some people will ask “what the he** do you teach your students, Menzie?” (That question is asked by the same person who argued that a recession occurred in 2022H1). Now you know.
Source link