Reader JohnH is surprised that BEA reports distributional NIPA data, despite having commented on a blogpost on the subject two and a half years ago (he commented three times!)
In an unmentioned recent development, BEA is actually providing data on income distribution, something which should be of interest to macro students.
Given that some folks do not remember what they’ve read and commented on, I re-post, with link to updated information.
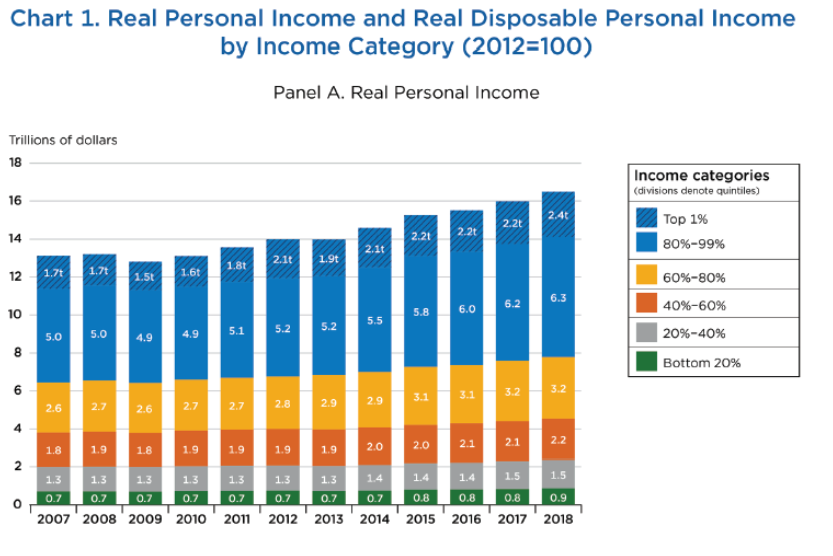
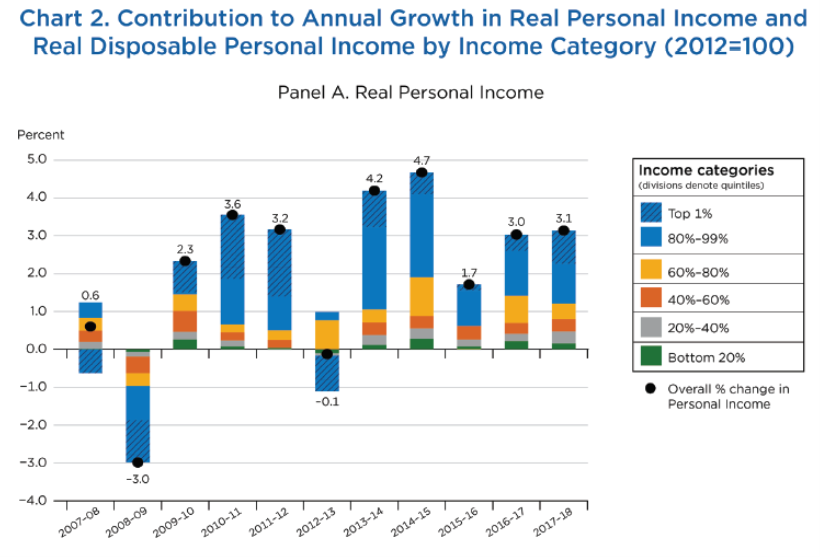
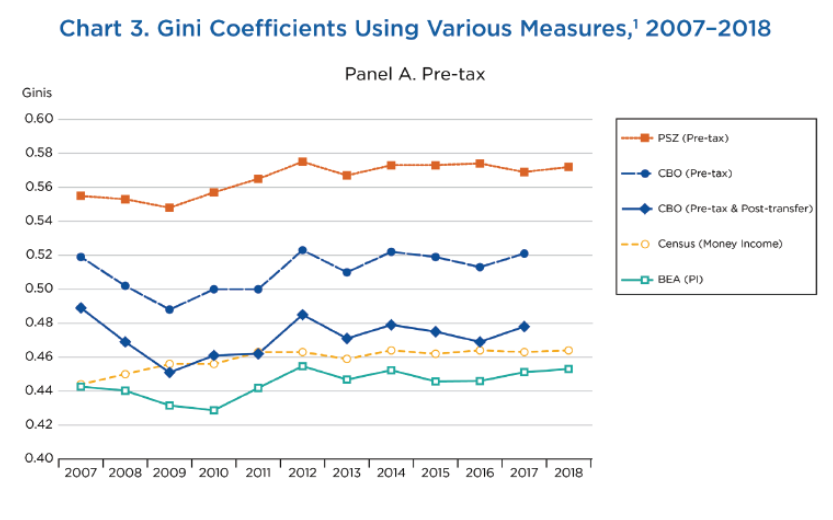
Using an incredibly powerful device called “the Google”, I have discovered new prototype data releases regarding the distributional aspects of real personal income. Here are some figures depicting income accruing to select household income percentiles, contributions to income growth therefrom, and Gini coefficients. These figures are from this Working Paper entitled “Measuring Inequality in the National Accounts” (updated 2020).
Source: Fixler, Gindelsky, Johnson, “Measuring Inequality in the National Accounts” (BEA, December 2020).
Source: Fixler, Gindelsky, Johnson, “Measuring Inequality in the National Accounts” (BEA, December 2020).
Source: Fixler, Gindelsky, Johnson, “Measuring Inequality in the National Accounts” (BEA, December 2020).
While some similar income statistics are available from the Census, these variables are constructed in a manner related to NIPA, so are useful for business cycle analysis. One could criticize the data as being at a relatively low frequency (annual). However, my guess is that reporting these series at higher frequency (e.g., quarterly) would entail such large amounts of interpolation and estimation that they would not be particularly useful.
The entire webpage on this subject is here. Technical details discussed here.
Update, 1/24/2024:
Since I wrote the above post 2.5 years ago, the BEA has updated its methodology, as described here.
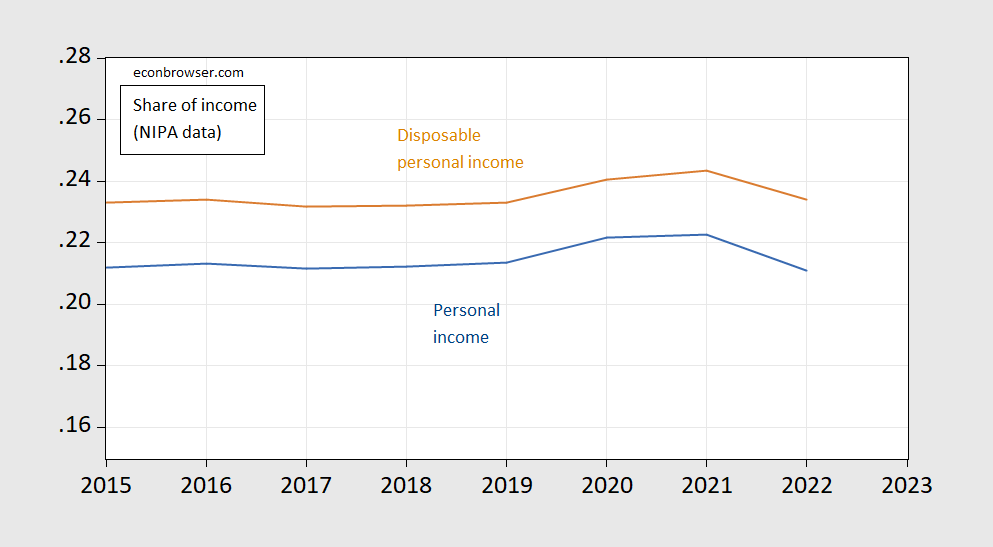
One time series now available through 2022 is share of income.
Figure 1: Share of personal income for bottom half of income distribution (blue), of disposable personal income (tan). Source: BEA, and author’s calculations..
Source link

