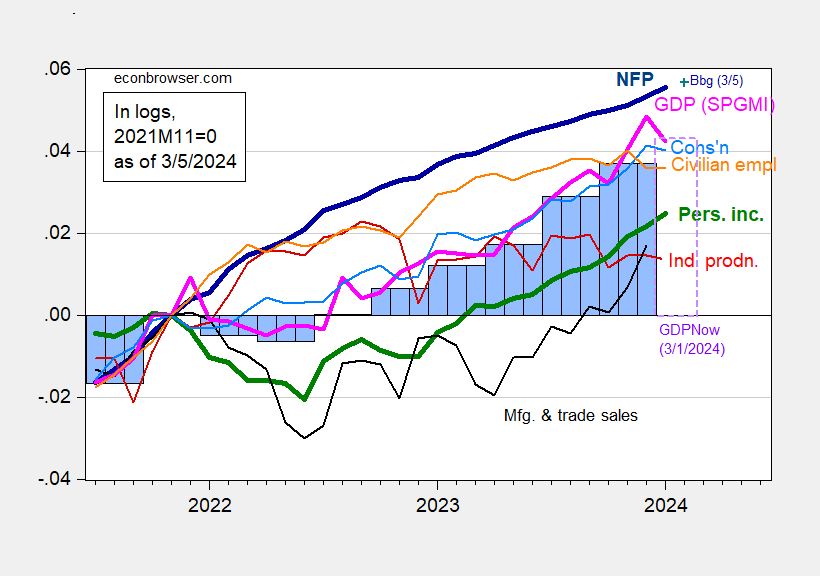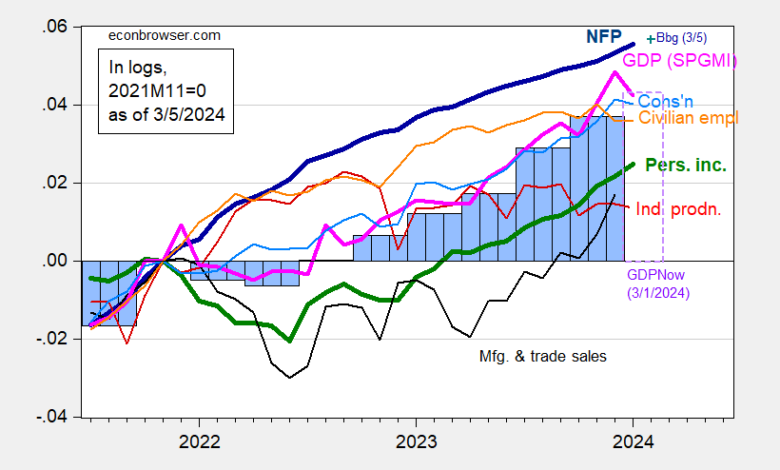
Monthly GDP declines 7.1 ppts m/m annualized Here’s a picture of key indicators followed by the NBER Business Cycle Dating Committee plus monthly GDP.
Figure 1: Nonfarm Payroll employment (bold dark blue), civilian employment (orange), industrial production (red), personal income excluding current transfers in Ch.2017$ (bold green), manufacturing and trade sales in Ch.2017$ (black), consumption in Ch.2017$ (light blue), and monthly GDP in Ch.2017$ (pink), GDP, 2nd release (blue bars), GDPNow for 2024Q1 as of 2/29 (lilac box), all log normalized to 2021M11=0. Source: BLS via FRED, Federal Reserve, BEA 2023Q4 2nd release, Atlanta Fed (3/1), S&P Global Market Insights (nee Macroeconomic Advisers, IHS Markit) (3/1/2024 release), and author’s calculations.
While January monthly GDP was down, final sales were only down by only 4.1 ppts m/m annualized, while nonfarm payroll (NFP) employment and personal income excluding current transfers were both up that month. According to the Bloomberg consensus, nonfarm payroll employment in February rose by 190K. Hence, the economy seems to have continued growth in January.
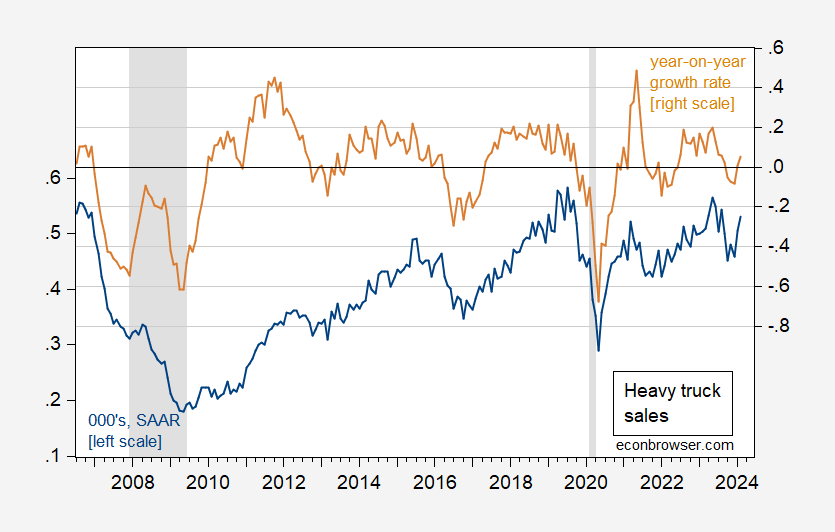
Calculated Risk points out that heavy truck sales increased in February. I’ve used this as a coincident indicator for recessions in the past (better than VMT, or gasoline consumption, for instance). Here’s the picture as of today.
Figure 2: Heavy truck sales, 000’s, s.a. (blue, left scale), and year-on-year growth rate of heavy truck sales (tan, right scale). NBER defined peak-to-trough recession dates shaded gray. Source: BEA via FRED, Calculated Risk for February, NBER, and author’s calculations.
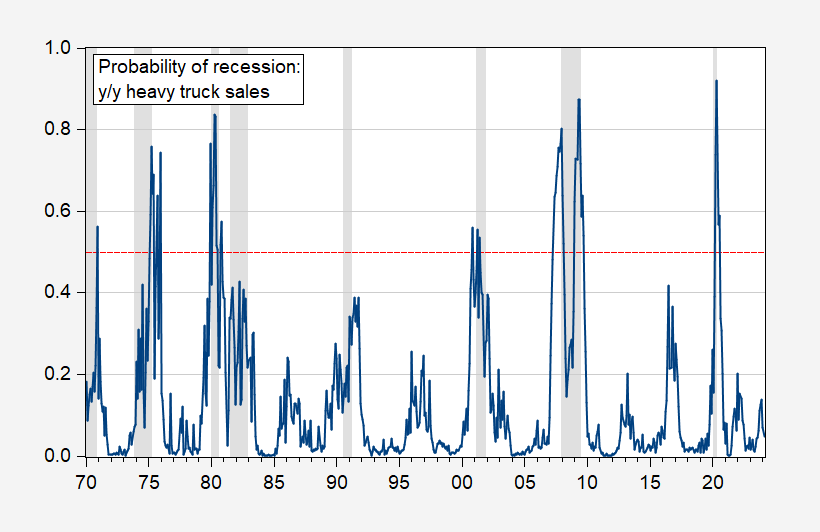
Over the 1970-2023 period, a probit regression has a pseudo-R2 of about 0.29, and indicates recessions (remember, this is as a coincident indicator) pretty well historically (except for 1990-91).
Figure 3: Estimated recession probabilities from probit regression, 1970-2023 (blue), red dashed line at 50% probability threshold. NBER defined peak-to-trough recession dates shaded gray. Source: NBER and author’s calculations.
Given the increase in heavy truck sales, I am even less inclined to consider February a start date for recession.
Source link

