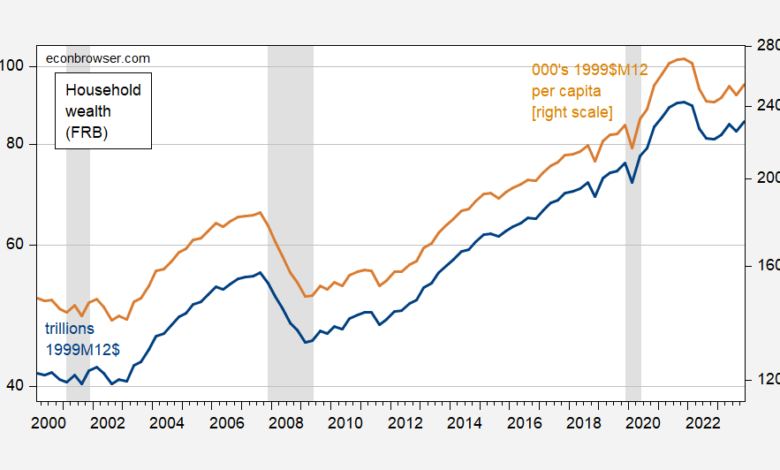
Rising in 2023Q4:
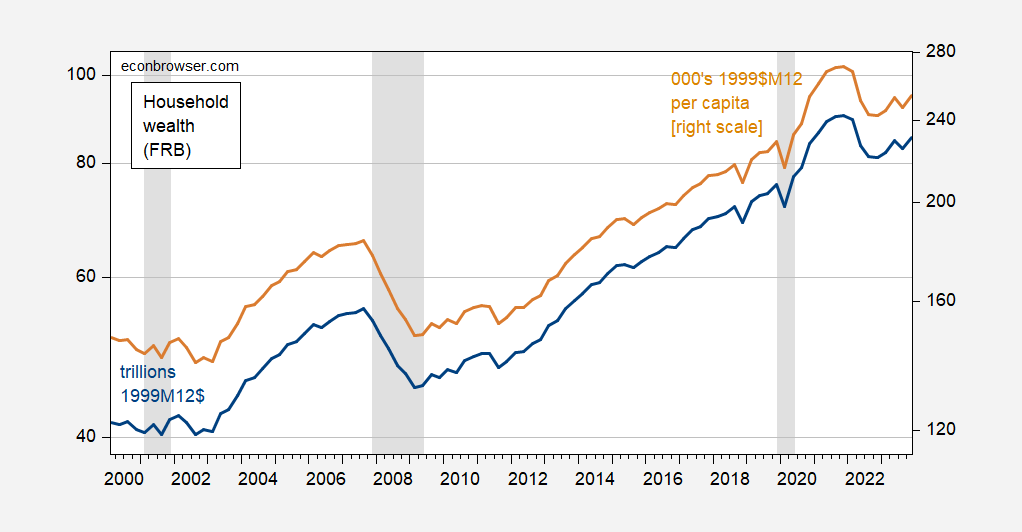
Figure 1: Household net worth, in trillions 1999M12 dollars (blue, left log scale), and per capita, in thousands of 1999M12 dollars. Deflated using chained CPI, seasonally adjusted by author using X-13. NBER defined peak-to-trough recession dates. Source: Federal Reserve Board Flow of Funds via FRED, BLS, NBER, and author’s calculations.
The Fed provides a picture of the composition of changes of net wealth (in trillions of dollars).
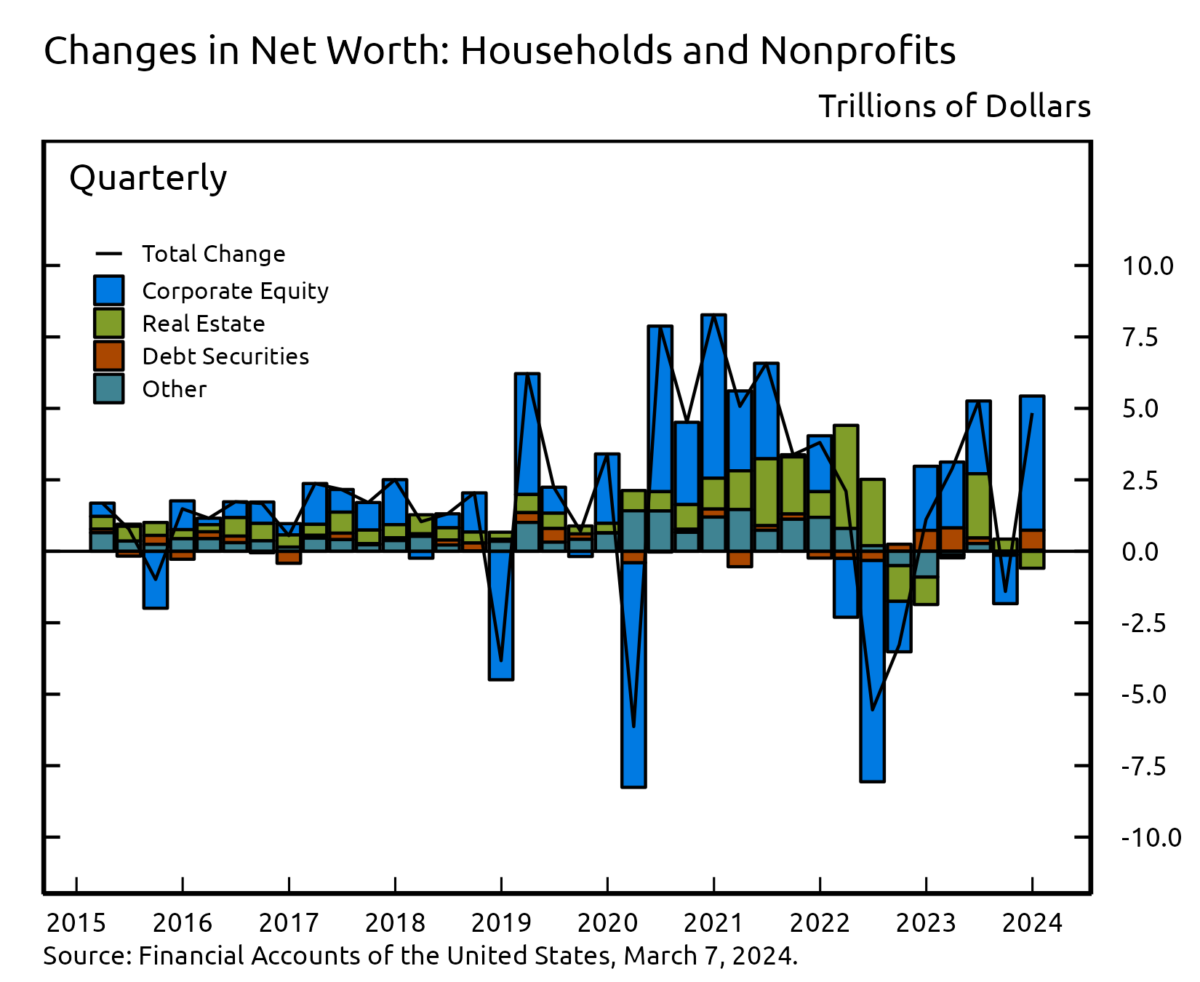
Source: Federal Reserve Board.
Source link