Forecast finalized in November (roughly same time as CBO’s projections, released in February).
First, GDP:
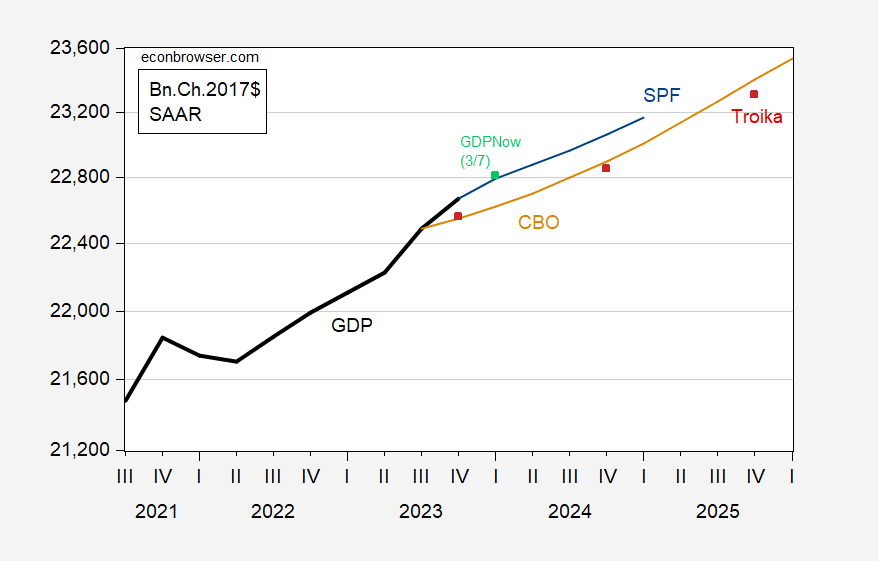
Figure 1: GDP (black), Administration forecast (red squares), CBO projection (tan), February Survey of Professional Forecasters (blue), GDPNow of March 7 (light green square), all in billions Ch.2017$ SAAR. Levels of GDP in Administration and GDPNow calculated using growth rates and levels of GDP available at time of forecast/nowcast. Source: BEA 2023Q4 2nd release, CBO (February), Philadelphia Fed (February), OMB (March), and Atlanta Fed (March 7), and author’s calculations.
Given the similar information sets available at early November when the two forecasts were generated, it’s not surprising the Administration and CBO have a similar outlook on GDP, even taking the fact that CBO’s projection is conditioned on current law, and the Administration’s is conditioned on the President’s budget. In fact, the Administration’s GDP forecast is virtually indistinguishable from the November SPF for 2023 and 2024.
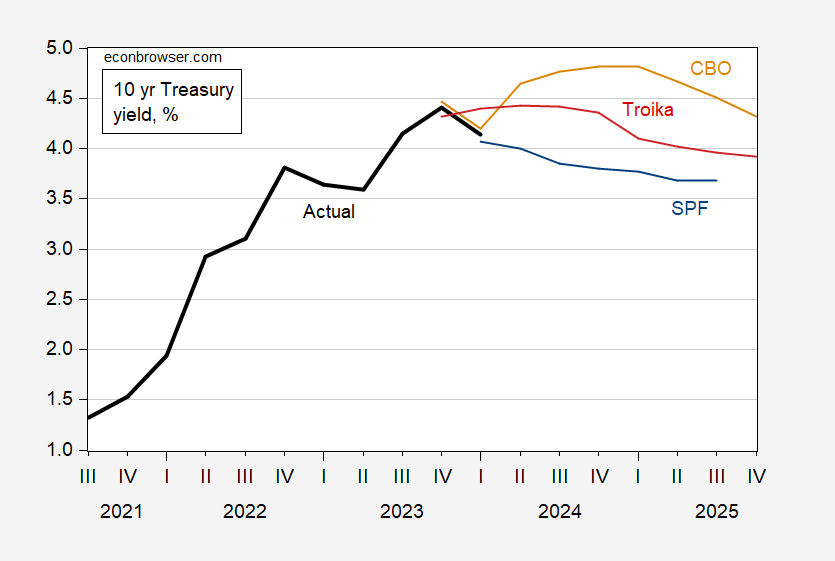
Both the CBO and the Administration forecast higher 10 year Treasury yields than economists in the SPF. (The Administration trajectory is a quadratic interpolation to quarterly data, since the Budget only reports annual yields.)
Figure 2: Ten year Treasury yields (black), Administration forecast (red line), CBO projection (tan), February Survey of Professional Forecasters (blue), all in %. 2024Q1 actual yield is based on January and February data. Administration quarterly forecasts interpolated from annual data using quadratic match. Source: Treasury via FRED, CBO (February), Philadelphia Fed (February), OMB (March), and author’s calculations.
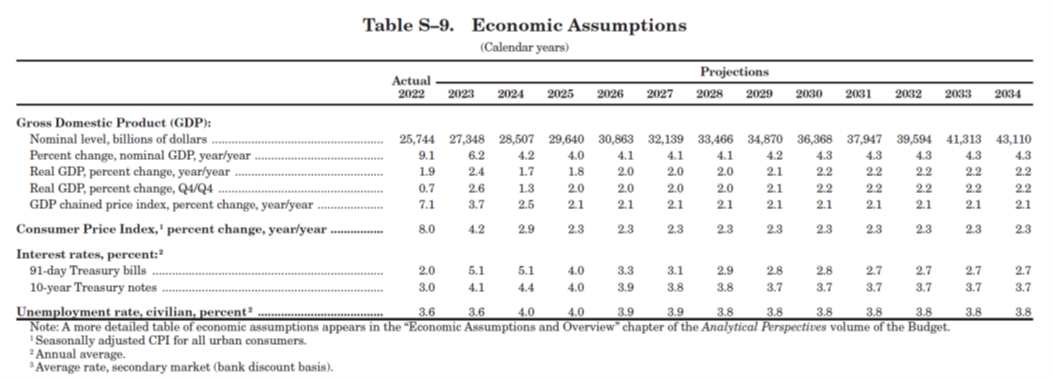
Here’s the table summarizing the forecasts.
Source: OMB (2024).
Source link

