Philadelphia Fed’s early benchmark indicates NFP employment is on lower trajectory than indicated by the CES measure, by about 600 thousands. How does this change the picture?
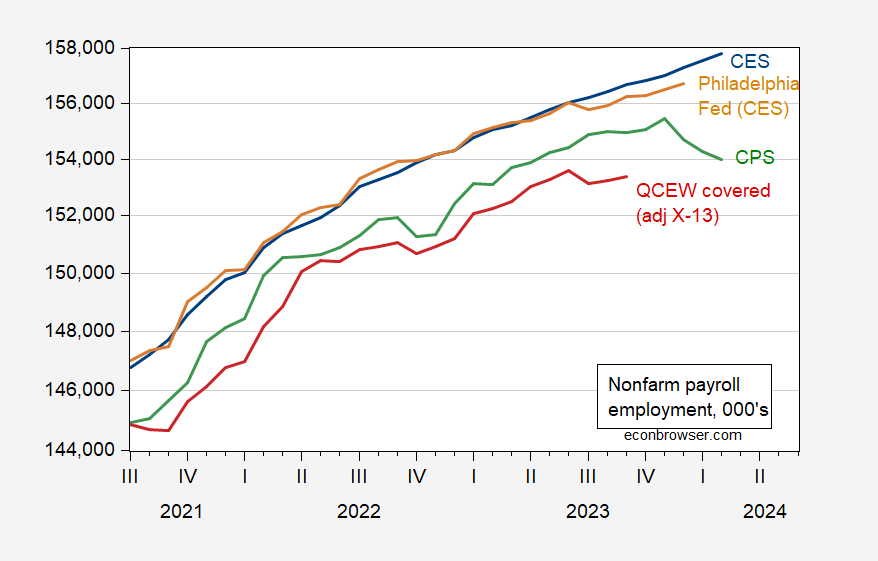
Figure 1: Nonfarm payroll employment from establishment survey (blue), from Philadelphia Fed early benchmark (tan), from household survey adjusted to NFP concept (green), and QCEW covered employment seasonally adjusted by author using X-13 (red), all in thousands. Source: BLS via FRED, Philadelphia Fed, BLS, BLS (QCEW), and author’s calculations.
For 2022, y/y growth was 2% using the official BLS measure, and 1.6% using the Philadelphia Fed post-benchmark measure (it’s 0.5% using the sum of states; however, the Philadelphia Fed cautions against using this measure). So, the early benchmark suggests a less “hot” labor market, but one still growing.
Note that in context, this does not change the overall picture of the business cycle.
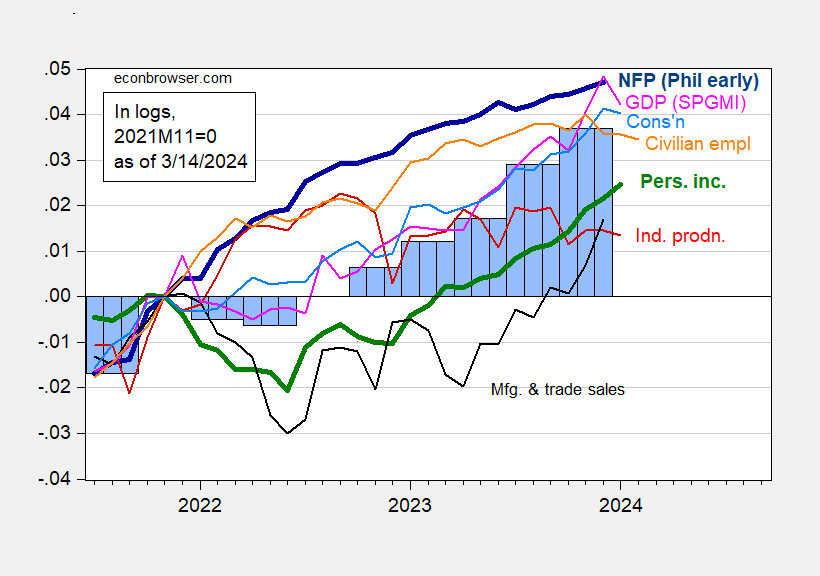
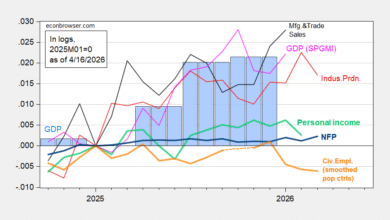
Figure 1: Nonfarm Payroll employment from Philadelphia Fed early benchmark (bold dark blue), civilian employment (orange), industrial production (red), personal income excluding current transfers in Ch.2017$ (bold green), manufacturing and trade sales in Ch.2017$ (black), consumption in Ch.2017$ (light blue), and monthly GDP in Ch.2017$ (pink), GDP, 3rd release (blue bars), all log normalized to 2021M11=0. Source: BLS via FRED, Federal Reserve, BEA 2023Q4 2nd release, S&P Global Market Insights (nee Macroeconomic Advisers, IHS Markit) (3/1/2024 release), and author’s calculations.
You can compare to the picture with the official NFP series here.
Source link