Industrial production near consensus, while manufacturing surprises on upside (+0.8% vs. +0.3% m/m). Here’s a picture of key indicators followed by the NBER Business Cycle Dating Committee, along with SPGMI’s monthly GDP (formerly from Macroeconomic Advisers and IHS-Markit).
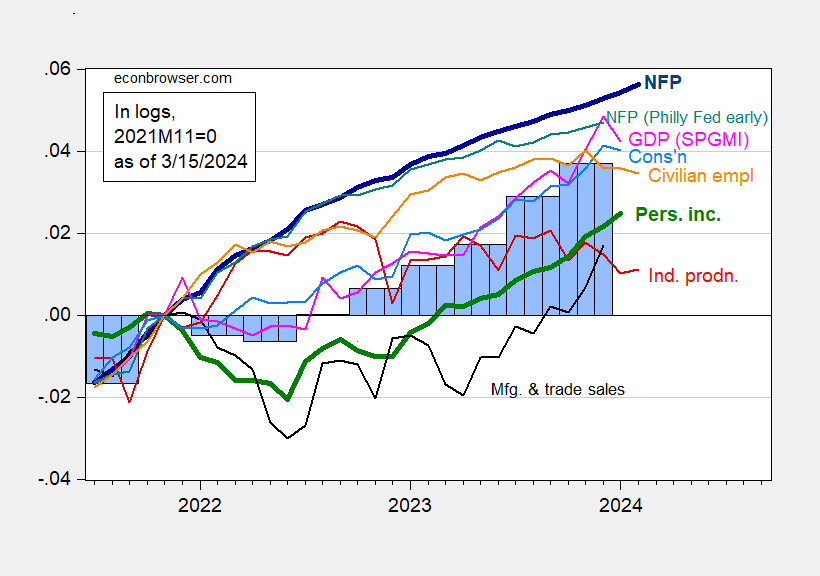
Figure 1: Nonfarm Payroll employment from CES (bold blue), from Philadelphia Fed early benchmark (teal), civilian employment (orange), industrial production (red), personal income excluding current transfers in Ch.2017$ (bold green), manufacturing and trade sales in Ch.2017$ (black), consumption in Ch.2017$ (light blue), and monthly GDP in Ch.2017$ (pink), GDP, 3rd release (blue bars), all log normalized to 2021M11=0. Source: BLS via FRED, Federal Reserve, BEA 2023Q4 2nd release, S&P Global Market Insights (nee Macroeconomic Advisers, IHS Markit) (3/1/2024 release), and author’s calculations.
I include the Philly Fed’s early benchmark CES series (not the sum of states) as a check on whether the BLS birth/death model is imparting too much job creation to the official series (see discussion in yesterday’s post).
Note that industrial production has been lackluster over the past year or so. Industrial production includes manufacturing, mining, and utilities. I thought it of interest to see how real value added, reported with a much greater lag, correlates with industrial production (which is a gross measure).
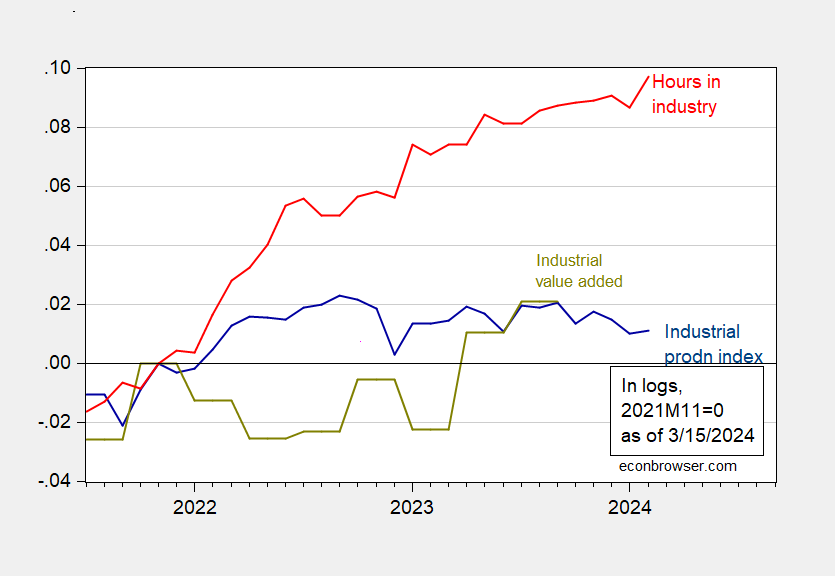
Figure 2: Industrial production index (blue), and value added in industry (sum of manufacturing, mining, and utilities), in 2017$ (chartreuse), aggregate weekly hours of production and nonsupervisory workers in industry (red), all in logs 2021M11=0. Note: Industrial value added calculated as simple sum of components, rather than using a Tornqvist approximation. Hours for industry includes logging (which is about 7% of employment in mining and logging). Source: FRB, BLS via FRED, BEA, and author’s calculations.
Industry value added and production index have moved in different ways since end-2021, but are roughly at the same level relative to 2021M11 as of Q3. Hours have moved up consistently, in contrast.
Manufacturing has shown less divergence.
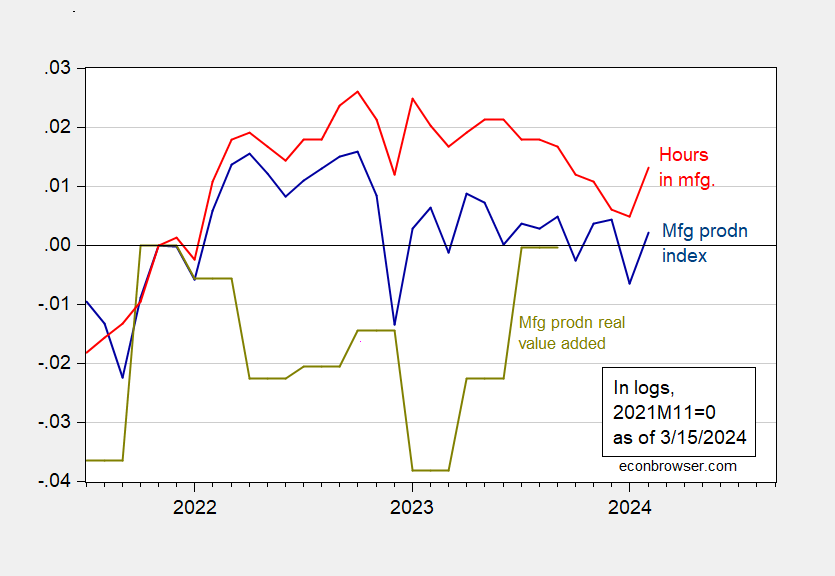
Figure 3: Manufacturing production index (blue), and value added in manufacturing, in 2017$ (chartreuse), aggregate weekly hours of production and nonsupervisory workers in manufacturing (red), all in logs 2021M11=0. Source: FRB, BLS via FRED, BEA, and author’s calculations.
Manufacturing value added did fall over the course of 2022, but has rebounded since, so that the level relative to 2021M11 is about the same as that for manufacturing production. From a business cycle perspective, the rebound in production and hours worked suggests the slowdown has moderated (one shouldn’t take too much from one month’s data, particularly preliminary).
Source link