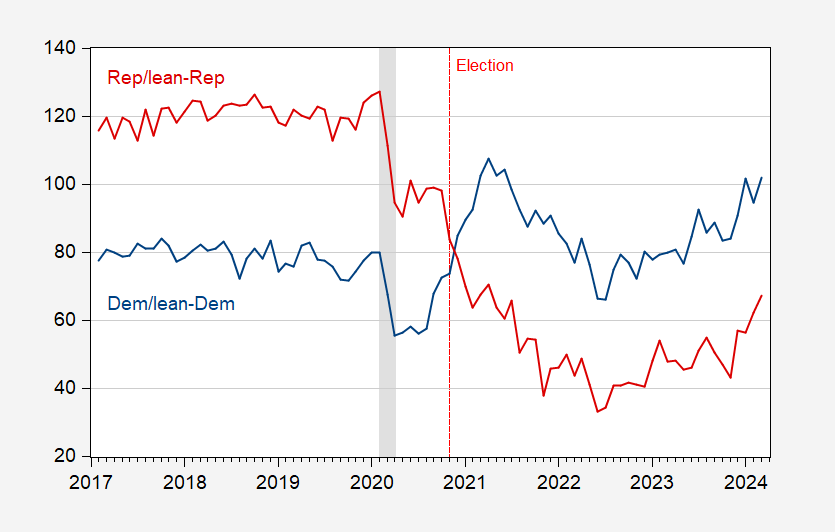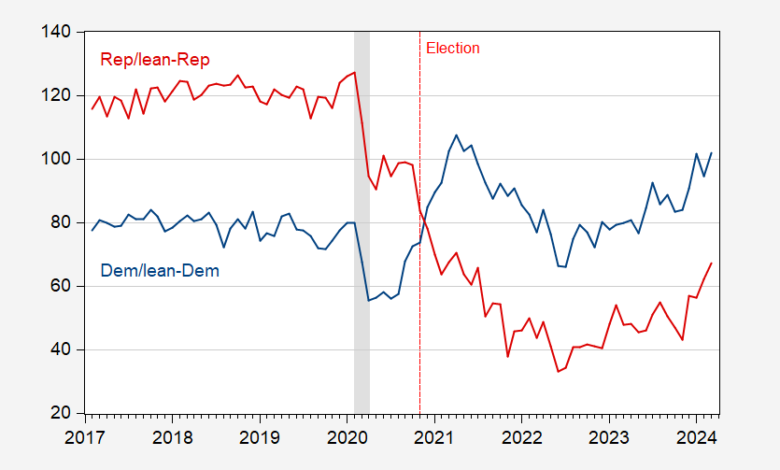
Here’s a plot to economic sentiment as recorded by the University of Michigan Survey of Consumers, by political affiliation:
Figure 1: University of Michigan Economic Sentiment index for Democrat/lean-Democrat (blue), and for Republican/lean-Republican (red). NBER defined peak-to-trough recession dates shaded gray. Source: University of Michigan Survey of Consumers, and NBER.
While sentiment shifts as control of the presidency shifts, it’s interesting to investigate the size of the shifts, and how respondents vary in the importance accorded various factors.
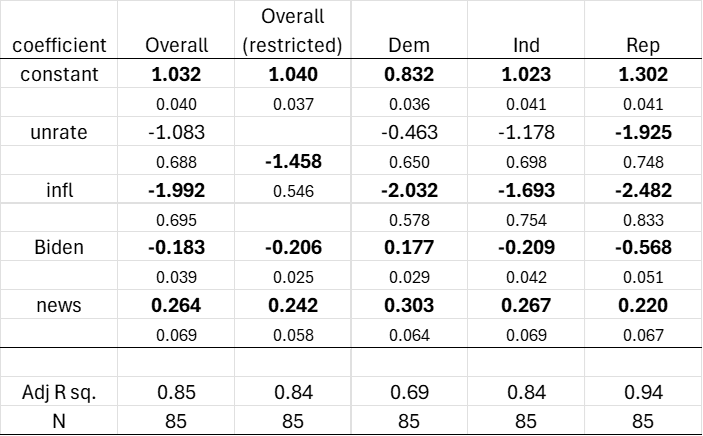
If one got the impression that Republican/lean-Republican respondents really, really ascribe a big negative to Biden’s presidency, one would be correct. This can be seen by running a regression of economic sentiment on unemployment, inflation, a Biden dummy variable and the SF Fed’s news sentiment index, over the 2017M02-2024M02 period (for which we have continuous time series for sentiment broken down by partisan affiliation).
Table 1. Regression coefficients with HAC robust standard errors. Bold denotes significance at the 5% msl. Sentiment, unemployment, inflation all expressed in decimal form.
Column (1) reports the results of running the Michigan survey series on these variables, while column (2) reports the same results, constraining the coefficients on unemployment and inflation to be the same (i.e., running the regression on the “misery index”).
Inflation and unemployment for the aggregate index have the expected sign, while the Biden dummy variable coefficient is significantly negative. The news sentiment index has the expected positive sign as well. A F-test does not reject the null hypothesis that the unemployment and inflation coefficients are of equal size. “Misery” then has a statistically significant coefficient.
The interesting findings pertain the the disaggregated responses. Democrat/lean-Democrat respondents as well as Independents have a smaller (in absolute value) weight on unemployment than on inflation. For Dem/lean-Dem, an F-test on whether the coefficients are the same rejects at the 5% msl. Hence, for this group, unemployment has a relatively lower weight. Republican/lean-Republican on the other hand have about equal weight on unemployment and inflation. They also have — relative to Dem/lean-Dem — a larger effect ascribed to inflation (2.5 vs. 2.0).
In contrast, Dem/lean-Dem are more affected by news sentiment than Rep/lean-Rep (0.30 vs. 0.22). This suggests that, regardless of whatever bias there is in the news reporting as suggested by Harris and Sojourner (2024), Rep/lean-Rep respondents are more impervious to information regarding the economy than Dem/lean-Dem.
The most interesting finding pertains to the coefficient on the Biden variable. For Dem/lean-Dem, the coefficient is +0.18, while that for Rep/lean-Rep the coefficient is -0.58, which is over three times as large (in absolute value). Another way to view the relative impact is to look at standard deviation normalized coefficients (sometimes called beta coefficients). For Rep/lean-Rep, the beta coefficients for Biden vs. inflation (the next most impactful variable) is 0.83 vs 0.18. For Dem/lean-Dem, Biden vs. news sentiment is 0.87 vs 0.57.
While the larger relative impact for Rep/lean-Rep for which party controls the presidency shows up in earlier data (we don’t have nearly as much for 2006-2016), the impact, to the extent to which we can measure it, seems larger for Biden than for Democratic presidents in general. (Not sure an F-test would confirm, but the coefficient is larger (in absolute value) in the last 7 years).
This distinction buttresses the findings in this post. For results not incorporating the news sentiment variable, see this post.
Source link

