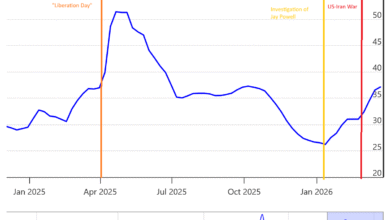
That’s the title of a Timoros/WSJ article three days ago:
Typically in the recovery from a downturn, households are more cautious about spending and are likely to save. When rates are low, borrowing supports spending. High rates choke off that spending.
This time, economic activity has been supported more by wealth and incomes than by credit. The pandemic altered spending habits which, together with higher asset prices, solid job prospects and government stimulus, left more households feeling flush.
As I noted in a previous recounting business cycle indicators for May/April, the answer to the above question could be: (1) the recession is here and we just don’t see it in the preliminary data, (2) the recession is still coming, since the timing between term spread inversion and recession onset is variable, (3) the model we used is wrong, (4) it’s just luck of the draw (earlier estimates based on shorter samples still did not indicate 100% probabilities, e.g. here).
Here is an updated assessment of recession probabilities (for 12 months ahead), including data through May 2024, and assuming no recession has arrived as of June 2024.
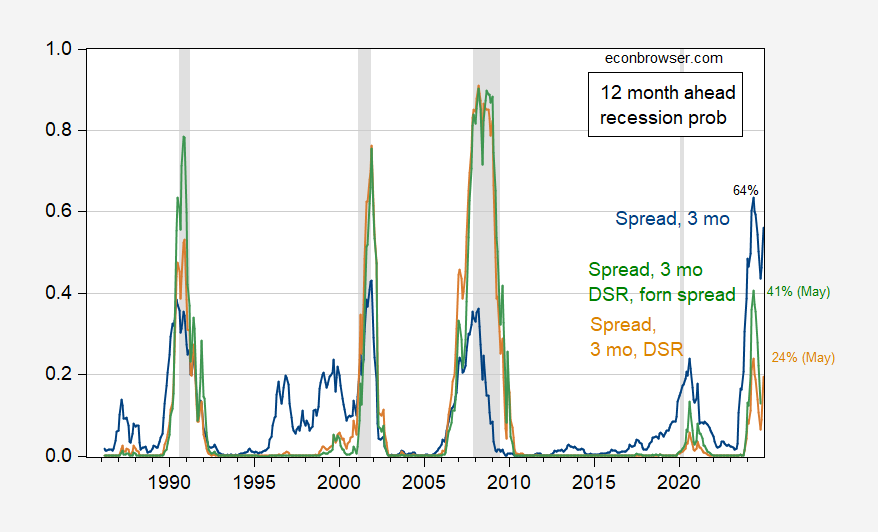
Figure 1: Probit estimated recession probabilities for 12 months ahead, using 10yr-3mo spread and 3 month rate (blue), 10yr-3mo spread, 3 mo rate, and debt-service-ratio for private nonfinancial sector (tan), and 10yr-3mo spread, 3 mo rate, debt-service-ratio for private nonfinancial sector, and foreign term spread (green). Sample for estimation 1985M03-2024M06. NBER defined peak-to-trough recession dates shaded gray. Source: Author’s calculations, and NBER.
Note that the foreign term spread augmented specification (an Ahmed-Chinn specification stripped of oil prices, equity returns/volatility, and financial condition index, augmented with debt service ratio) only peaks at 41% for May. The DSR augmented specification (following Chinn-Ferrara, omitting financial conditions index) produces a 24% peak recession probability for May 2024. This latter specification incorporates the idea of strong consumer balance sheets, and the insulation of mortgage holders via fixed rate mortgages, to the extent that the debt service ratio remains relatively low.
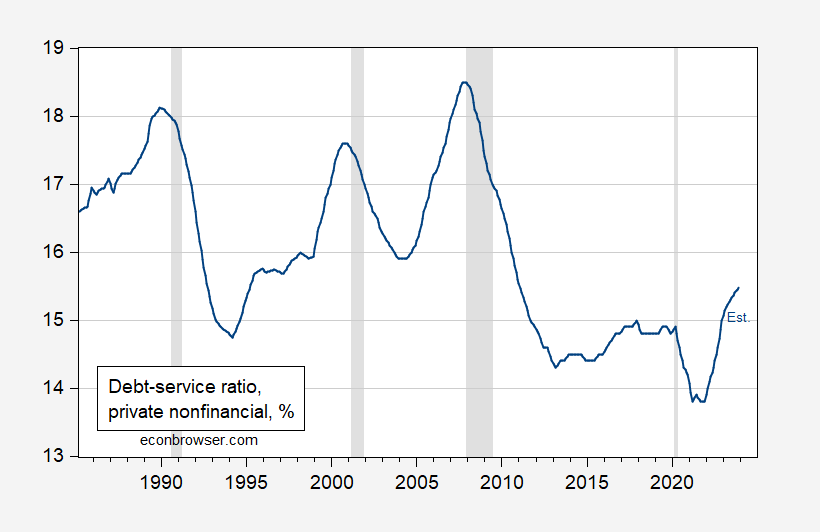
Figure 2: Debt-service ratios for nonfinancial private sector, % (blue). 2023Q4 is estimated using interest rates (see here). NBER defined peak-to-trough recession dates shaded gray. Source: BIS, Dora Fan Xia, NBER, and author’s calculations.
Peak estimated probabilities are for May 2024; we have only employment data for May (at the monthly frequency).
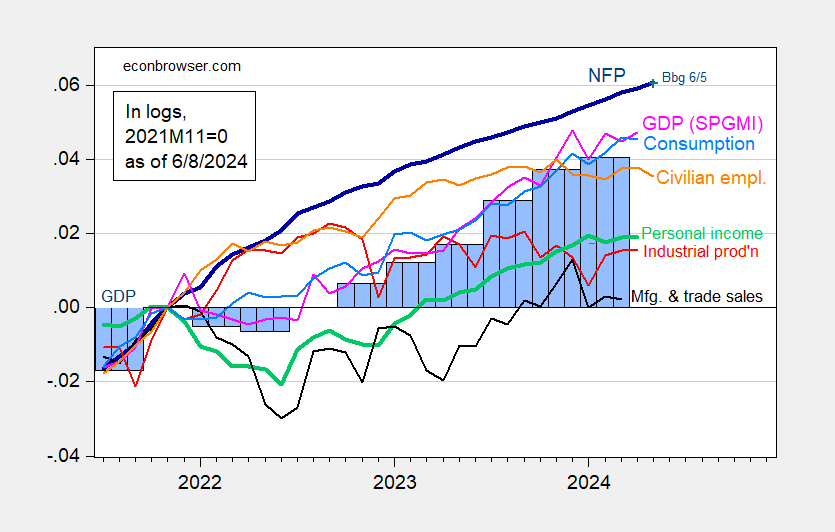
Figure 3: Nonfarm Payroll (NFP) employment from CES (bold blue), civilian employment (orange), industrial production (red), personal income excluding current transfers in Ch.2017$ (bold green), manufacturing and trade sales in Ch.2017$ (black), consumption in Ch.2017$ (light blue), and monthly GDP in Ch.2017$ (pink), GDP (blue bars), all log normalized to 2021M11=0. Source: BLS via FRED, Federal Reserve, BEA 2024Q1 second release, S&P Global Market Insights (nee Macroeconomic Advisers, IHS Markit) (6/1/2024 release), and author’s calculations.
And other more reliable indicators suggest less robust growth, at least through end 2023.
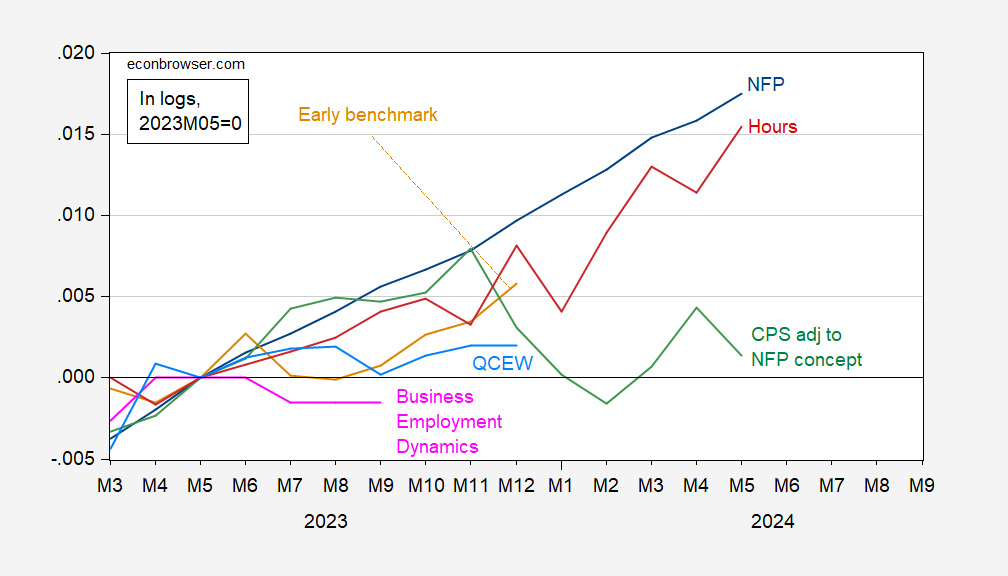
Figure 4: Nonfarm payroll employment (blue), early benchmark, calculated by adjusting actual using ratio of early benchmark sum of states to CES sum of states (tan), CPS measure adjusted to NFP concept (green), QCEW total covered employment seasonally adjusted by author by using geometric moving average (sky blue), Business Employment Dynamics net growth cumulated on 2019Q4 NFP (pink), and aggregate hours (red), all in logs, 2023M05=0. Source: BLS, Philadelphia Fed, and author’s calculations.
Source link