That’s the title of an article by Heritage’s EJ Antoni:
In the last quarter of 2023, these monthly job reports showed an increase of nonfarm payrolls by 637,000—robust growth, to be sure. But a much larger survey of businesses indicates this was a wild overestimation.
The BLS also publishes a Business Employment Dynamics, or BED, report each quarter, which comes from a much larger survey of 9.1 million private establishments. That’s more than 10 times the size of the survey used in the monthly job reports, so the BED has the law of large numbers on its side when debating accuracy.
This significantly larger survey showed only 344,000 jobs added in the final quarter of 2023, or roughly half the amount estimated by the monthly job reports. Contrary to the glowingly positive business news headlines each month, the labor market is not that strong after all. [emphasis added by MDC]
Interestingly, Dr. Antoni is comparing apples to oranges (NFP to private NFP). The correct comparison is private NFP to private NFP. I do this in the following graph.

Figure 1: Change in private nonfarm payroll employment in 2023Q4, in 000’s, from CES (blue), from Business Employment Dynamics survey (tan), from ADP (green), from QCEW seasonally adjusted by author using X-13 (red). Monthly series sampled at end-of-quarter. Source: BLS, ADP, and author’s calculations.
If 464K looks less than twice 344K, you’d be right. 637K, which is what Dr. Antoni mentions, is total nonfarm payroll employment, not private nonfarm payroll employment. Do the correct comparison, and it’s only a third smaller. ADP — not a survey based figure — has a value slightly higher than coming from the BLS’s BED. Now, the Quarterly Census of Employment and Wages (QCEW) is not seasonally adjusted as reported. I seasonally adjust the series using X-13 using log transform. The resulting number at 34K is much smaller so better suits the case Dr. Antoni is making. On the other hand, these figures, while not coming from a survey but rather a census, are preliminary. As more tax (withholding etc.) come in, they will be revised.
Perhaps it’s better to look at trends, rather than a single quarter’s worth of data. Here are cumulative changes over 2023.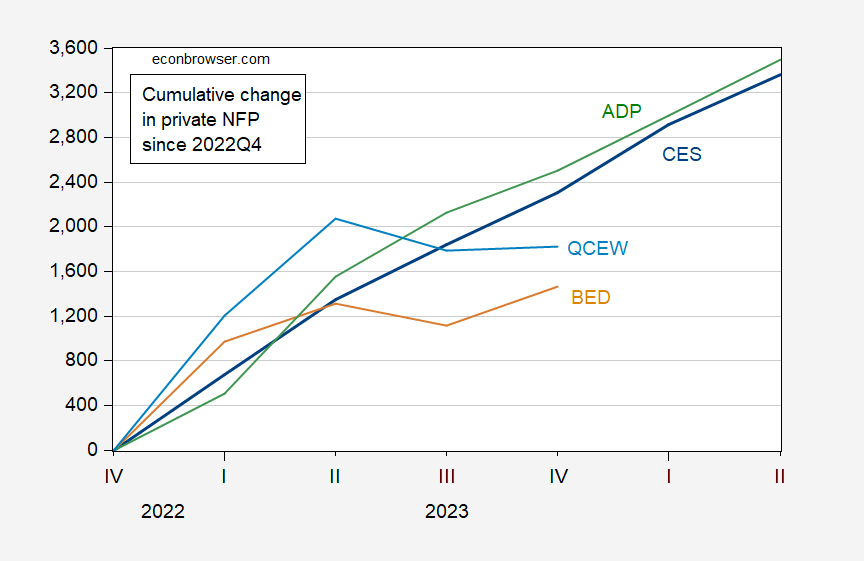
Figure 2: Change in private nonfarm payroll employment since 2022Q4, 000’s, from CES (blue), BED (tan), ADP (green), BED (tan). All monthly series end-of-quarter. QCEW seasonally adjusted by author using X-13. Source: BEA, ADP via FRED, and author’s calculations.
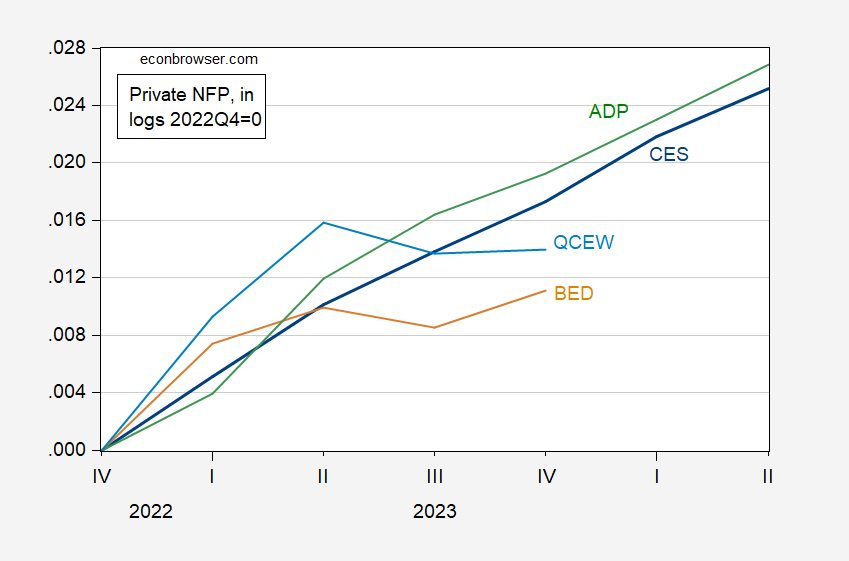
Figure 3: Cumulative percentage change in private nonfarm payroll employment since 2022Q4, from CES (blue), BED (tan), ADP (green), BED (tan). All monthly series end-of-quarter. QCEW seasonally adjusted by author using X-13. Source: BEA, ADP via FRED, and author’s calculations.
As of the end of 2023, private NFP had risen 2304 (1.7%) according to CES, while it had only risen 1820 (1.4%) according to the QCEW. So Dr. Antoni is correct that alternative measures suggest slower growth, but not as much as he implies in his article. For more employment comparisons against April 2023, see this post.
Dr. Atonji also has a more general critique of government statistics’ relationship to reality here.
Source link