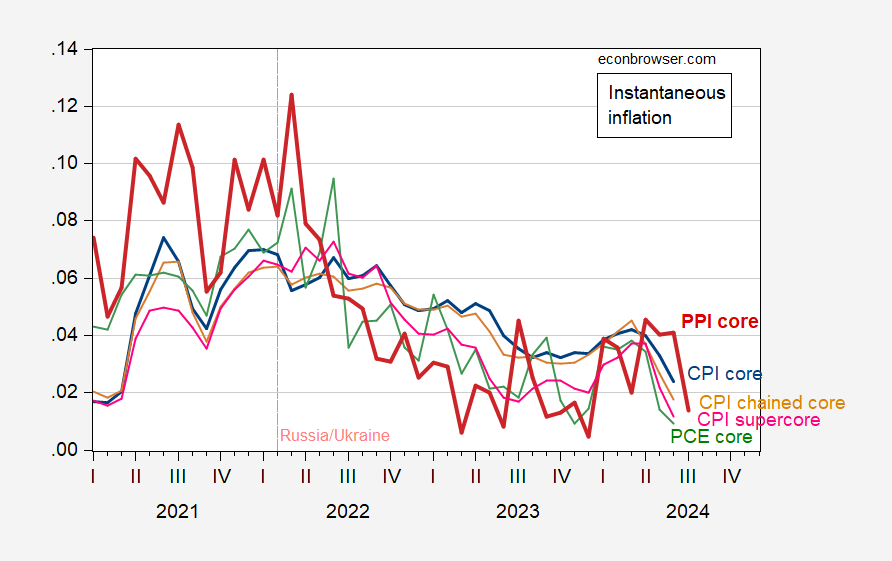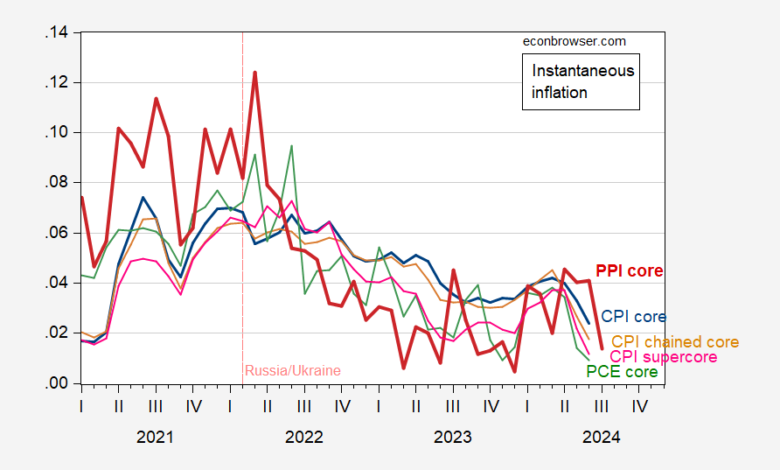
Core PPI 0.0% m/m vs +0.2% consensus (+2.4% y/y vs. +2.7% consensus). Here’s a picture of instantaneous core measures.
Figure 1: Instantaneous inflation for core CPI (blue), chained core CPI (tan), supercore CPI (pink), PPI core (red), and PCE core (green), per Eeckhout (2023), T=12, a=4. Source: BLS, BEA, Cleveland Fed, and author’s calculations.
It’s tempting to conclude this movement will feed into the CPI inflation, July figures to be released tomorrow, but this is not obviously the case. See this post for discussion of formal econometric analyses of whether PPI leads CPI.
Source link

