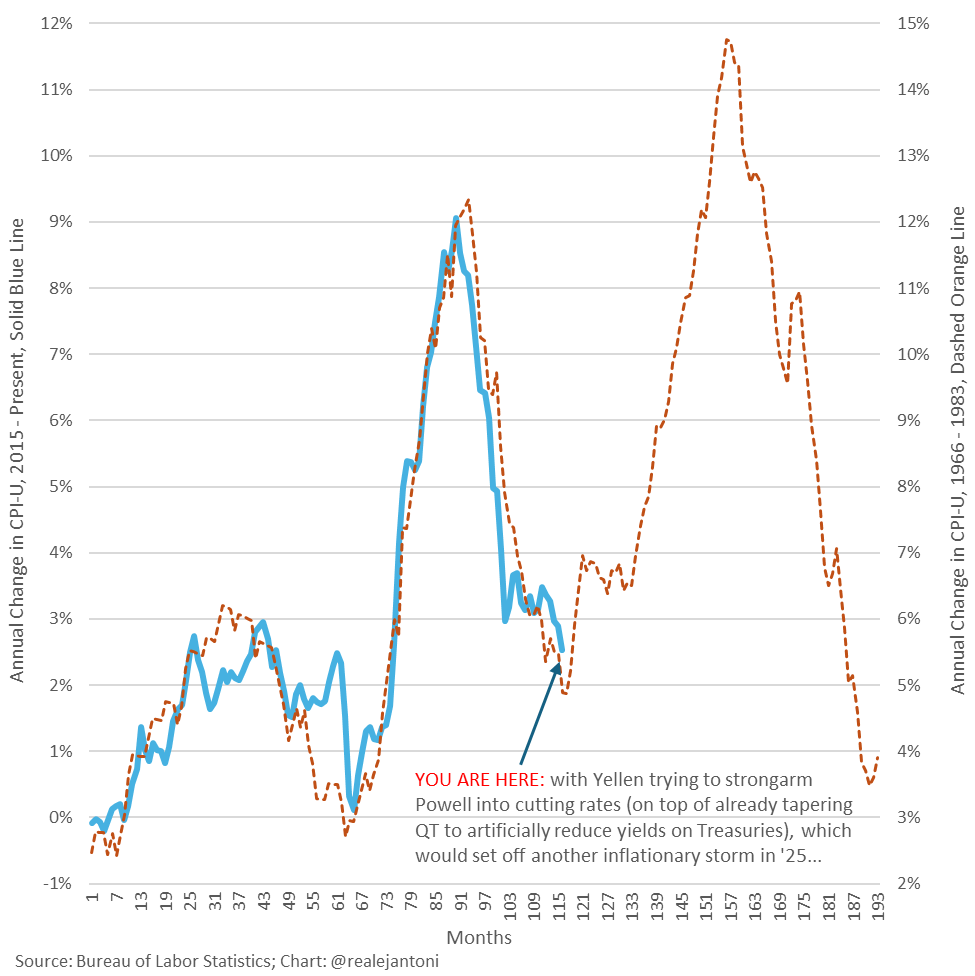
EJ Antoni/Heritage presents this picture which should scare the beejeebus out of us.
Source: EJ Antoni/X.
I can imagine Secretary Yellen trying to “strongarm” Russians trying to evade sanctions. I can imagine Secretary Yellen strongarming tax evaders. I must confess I can’t imagine Yellen “strongarming” Jerome Powell. I’d like to know where Dr. Antoni has received information in this regard.
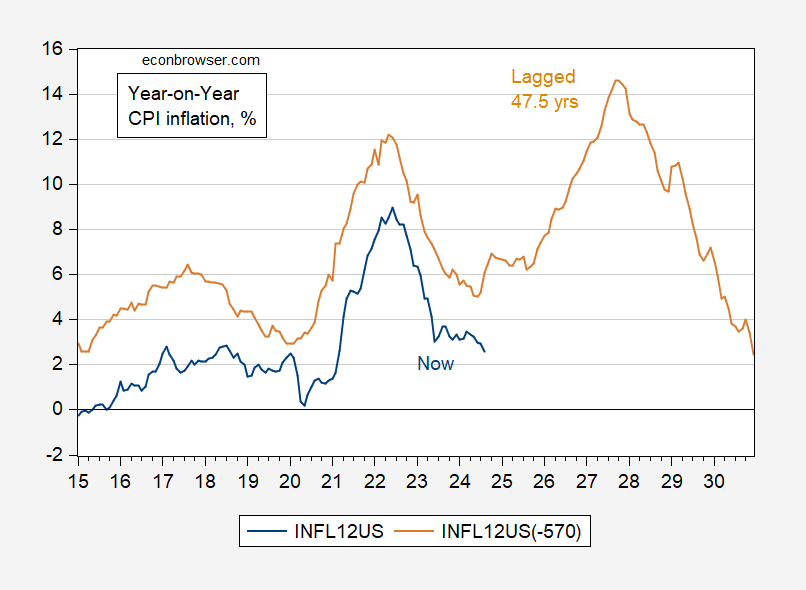
In any case, I thought the picture was a bit off, so I maximized the correlation, so as to replicate the peaks and troughs of inflation. The magic number was 47.5 years.
Figure 1: Year-on-Year CPI inflation (blue), and lagged 47.5 years (tan), both in %. Source: BLS via FRED, author’s calculations.
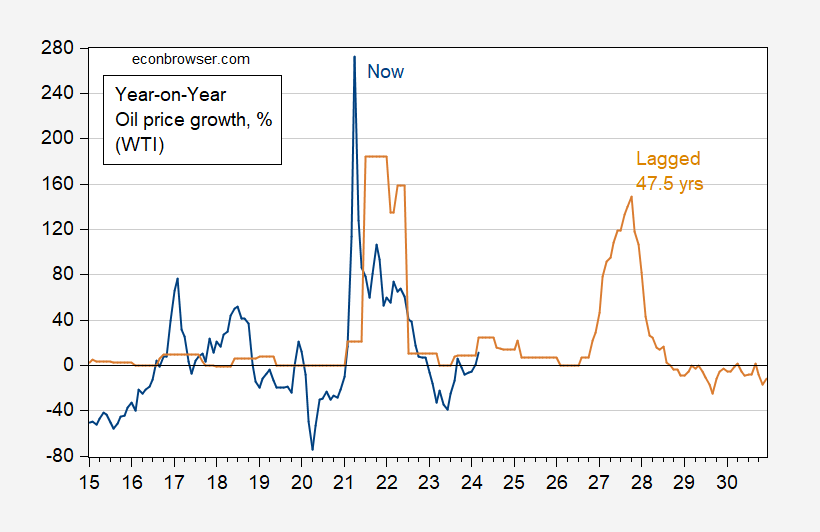
This seems to suggest that inflation reared its ugly head again in 1979 because of a premature loosening of monetary policy. While this might’ve contributed to accelerating inflation in 1979, I suspect one might want to take into account commodity price shocks in 1978 and 1979, the largest of which was oil…
Figure 1: Year-on-Year growth in oil prices (WTI) (blue), and lagged 47.5 years (tan), both in %. Source: EIA via FRED, author’s calculations.
So, sure, if one expects oil prices to jump 160%or so in 2027, then expect another surge in CPI inflation…(although as Blanchard and Gali (2009) have noted, the sensitivity of output and inflation to oil shocks is less pronounced than in the 1970s and 1980s).
Source link

