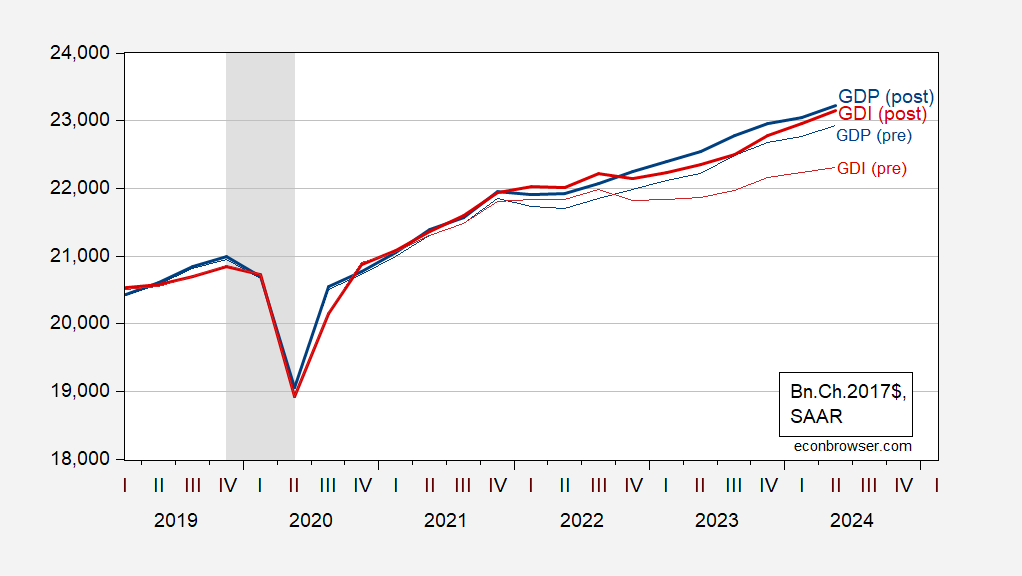
One of the interesting aspects of the annual revision is that, contrary to what happens with typical (non-annual) revisions, GDI moved toward GDP, rather than the reverse.
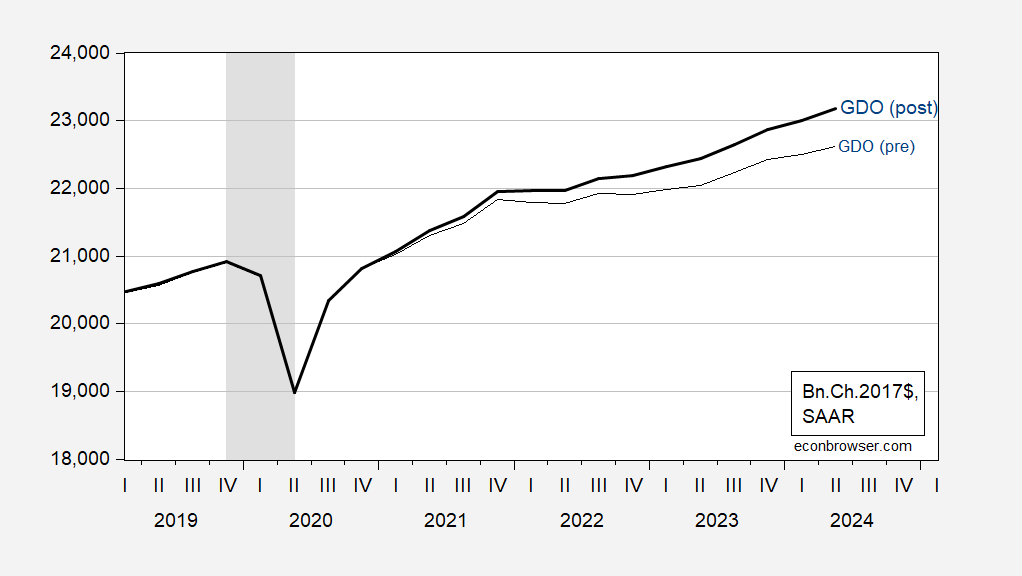
Figure 1: GDP post-update (bold blue), GDP pre-update (blue), GDI post-update (bold red), GDI pre-update (red), all in bn.Ch.2017$ SAAR. NBER defined peak-to-trough recession dates shaded gray. Source: BEA, 2024Q2 3rd release/annual update, BEA 2024Q2 2nd release, NBER, and author’s calculations.
Figure 2: GDO post-update (bold blue), GDO pre-update (blue), all in bn.Ch.2017$ SAAR. NBER defined peak-to-trough recession dates shaded gray. Source: BEA, 2024Q2 3rd release/annual update, BEA 2024Q2 2nd release, NBER, and author’s calculations.
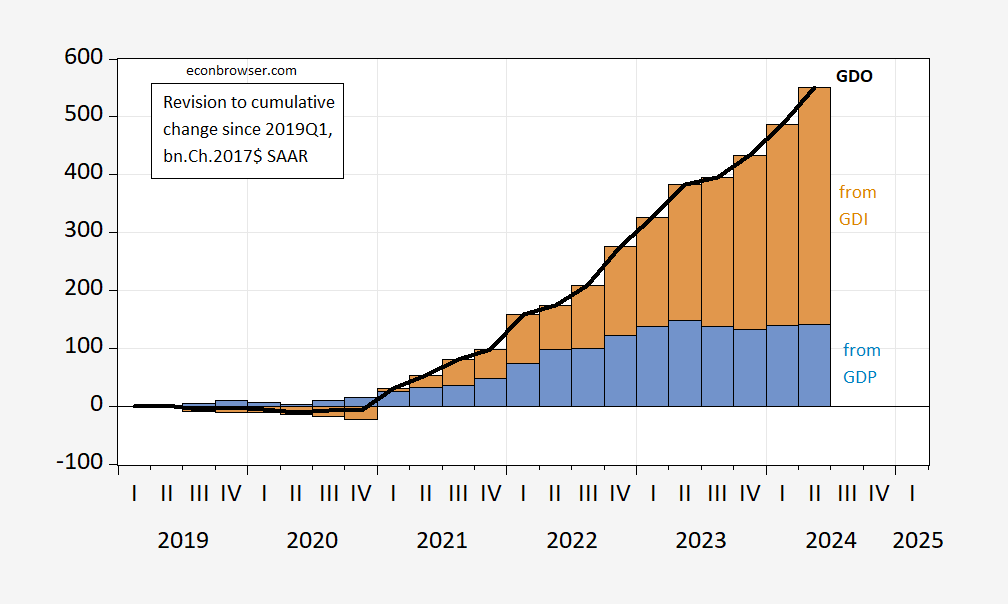
GDP was revised up, but GDO was revised up even more. This is shown in Ch2017$ terms in Figure 3 (where the annual revisions apply to 2019-2023).
Figure 2: Relative to 2019Q1, change in GDO post-vs-pre update (bold black line), change attributable to GDP (blue bars), change attributable to GDI (tan bars), all in bn.Ch.2017$ SAAR. Source: BEA, 2024Q2 3rd release/annual update, BEA 2024Q2 2nd release, NBER, and author’s calculations.
The lion’s share of the change in GDO vs pre-update is attributable to changes in GDI. This matches up with claims that BEA had been undercounting/estimating non-labor income.
Source link

