Suppose it’s the end of August, and one want to get the best estimate of Wisconsin real GDP for Q2. As of August, only Q1 Wisconsin GDP is available. What’s the best guess of of Q2 GDP, keeping in mind the number of monthly indicators at the state level is much lower than that for the Nation. Here’s my tentative answer.
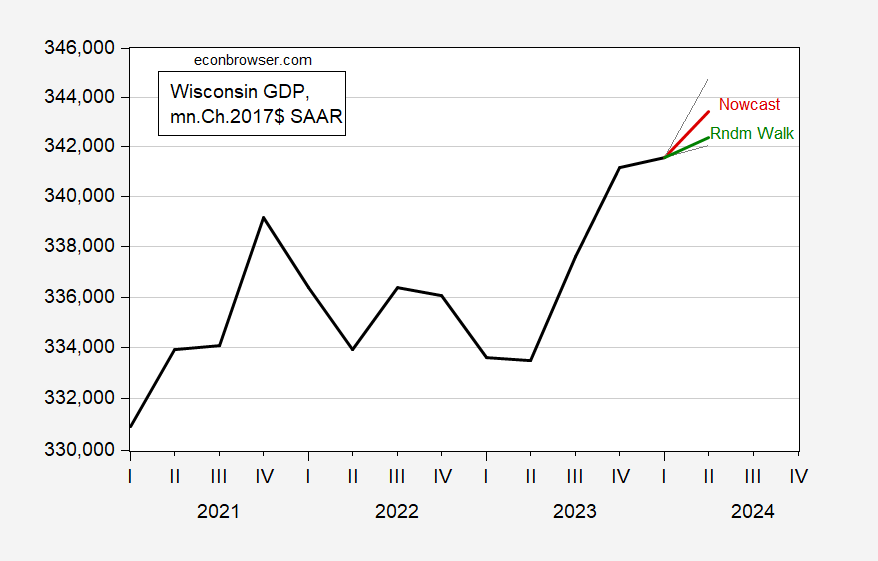
Figure 1: Wisconsin GDP (bold black), random walk with drift forecast (green), error correction model (red), +/- one standard error band (gray lines), all in mn.Ch.2017$ SAAR. Source: BEA, author’s calculations.
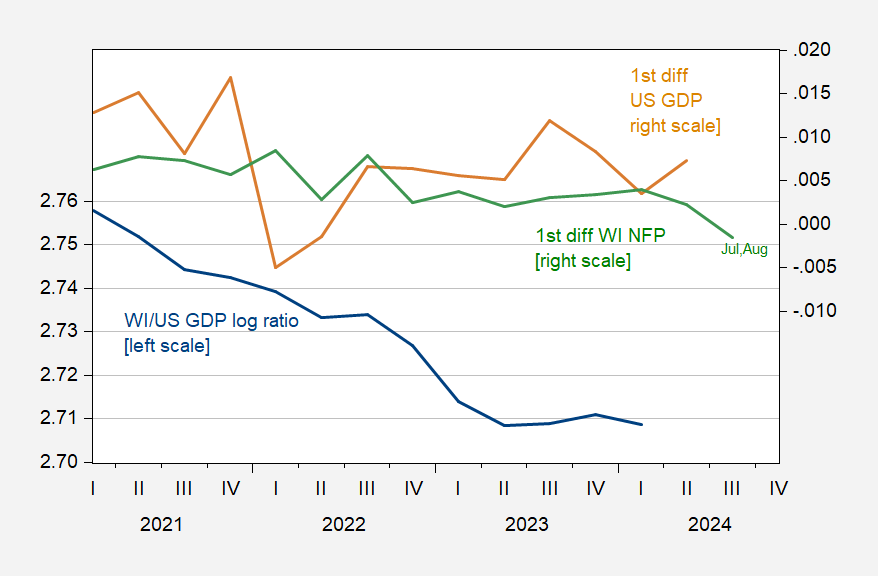
Forecast based upon these data, and this regression:
Figure 2: Wisconsin GDP to US GDP, in logs (blue, left scale), US GDP in log first differences (tan, right scale), Wisconsin NFP in log first differences (green, right scale), all s.a. 2024Q3 WI NFP observation is the average for July, August. Source: BEA, BLS, author’s calculations.
ΔyWIt= 0.720 + 1.130ΔyUSt – 0.268(yWIt-1-yUSt-1) + 1.428ΔnWIt
Adj-R2 = 0.78, SER = 0.0036, N=13, DW=1.85, sample 2021Q1-2024Q1. Bold face indicates statistical significance at 10% msl, using Newey-West standard errors.
13 observations seems like a slender thread to hang a nowcast upon. Unfortunately, this specification fails completely for the full sample of available data (2005Q1-2024Q1, where I’ve spliced the real GDP series in Ch.2012$ and Ch.2017$). Pre-pandemic, the error correction terms has a positive sign; this is true, regardless of whether the pandemic recession and immediate aftermath (2020Q1-2020Q4) is omitted or not. Rather, a single regressor dominates (US GDP growth). Here’s a comparison:
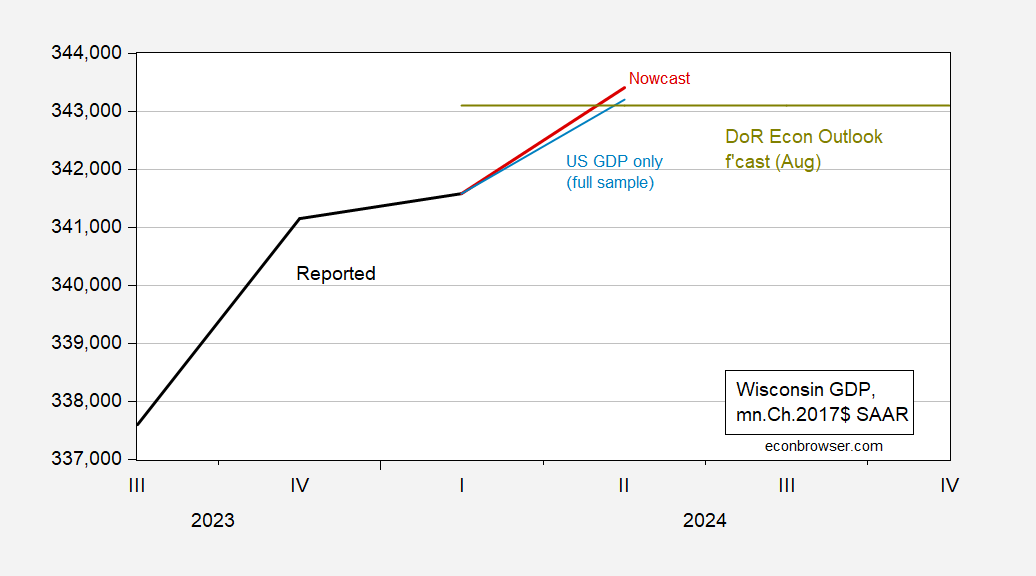
Figure 3: Wisconsin GDP (bold black), full-sample US GDP based (light blue), error correction model (red), Wisconsin DoR Economic Outlook forecast (chartreuse), all in mn.Ch.2017$ SAAR. Source: BEA, DoR, author’s calculations.
While the difference between the two nowcasts seems small, the implied difference in q/q annualized growth rates is noticeable: 2.1% vs. 1.9%.
The release of Wisconsin GDP is slated for tomorrow.
Source link

