A common refrain I see in some conservative circles is that employment gains or GDP are juiced by “fake” activity, of which government spending is one and health care services are another (health care services are allegedly “fake” by virtue of being mostly government funded – at least that’s the argument I see a lot).
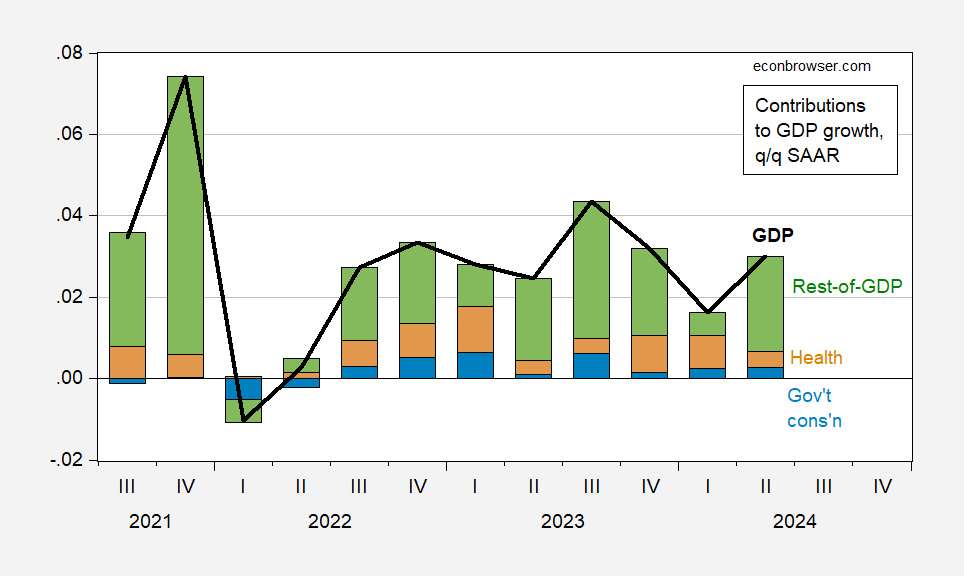
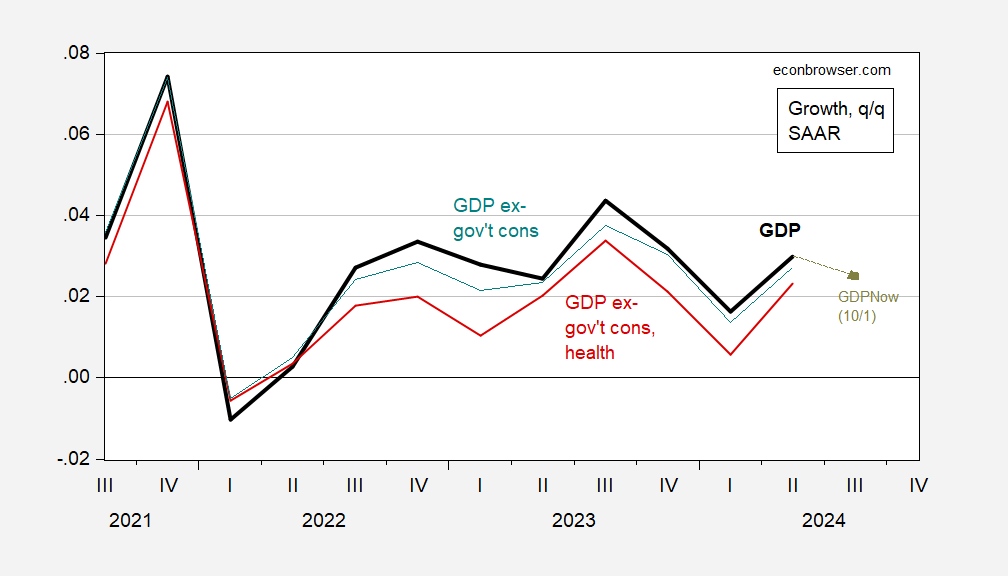
So, here’re two pictures of GDP accounting for these arguments, and two pictures of employment (aside: if you think that heart operation you got had zero utility for you, these are the graphs for you!):
Figure 1: GDP growth q/q SAAR (black line), contribution from health care consumption (tan bar), from government consumption (blue bar), from rest-of-GDP (green bar). Source: BEA 2024Q2 release/annual update, and author’s calculations.
Figure 2: GDP growth q/q SAAR (black line), GDPNow 10/1 estimate (chartreuse box), GDP growth ex government consumption (teal), growth ex-government consumption and health care consumption (red), Source: BEA 2024Q2 release/annual update, and author’s calculations.
Hence, growth is still pretty positive since 2022Q1, regardless of whether government consumption, or health care consumption, is excluded.
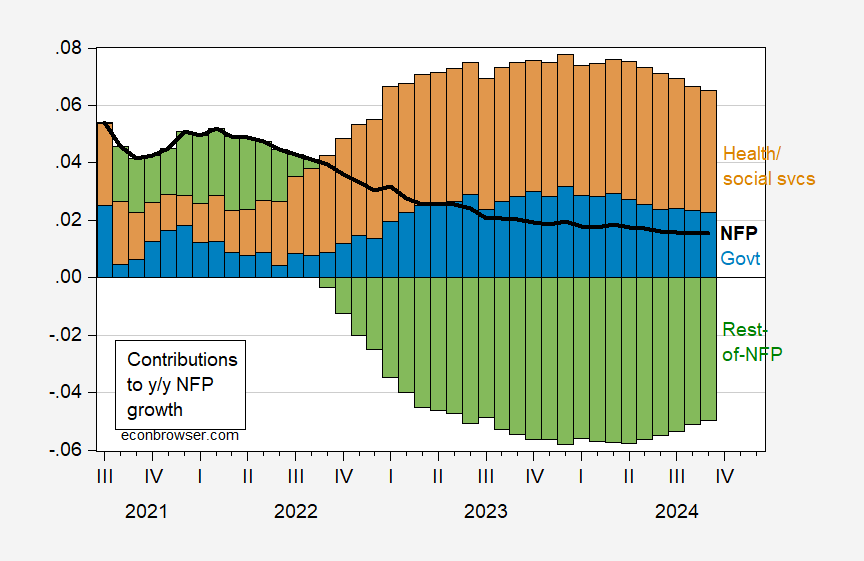
What about employment? As EJ Antoni has noted, over half of y/y employment growth is accounted for by government and health care.
Figure 3: Nonfarm payroll (NFP) employment growth y/y (black line), contribution from health care and social services (tan bar), from government (blue bar), from rest-of-NFP (green bar). Source: BLS and author’s calculations.
Dr. Antoni notes:
More than half of last 12-months of job growth has come from gov’t and the gov’t-dominated healthcare sector; it’s all tax-payer funded, and it’s not at all sustainable
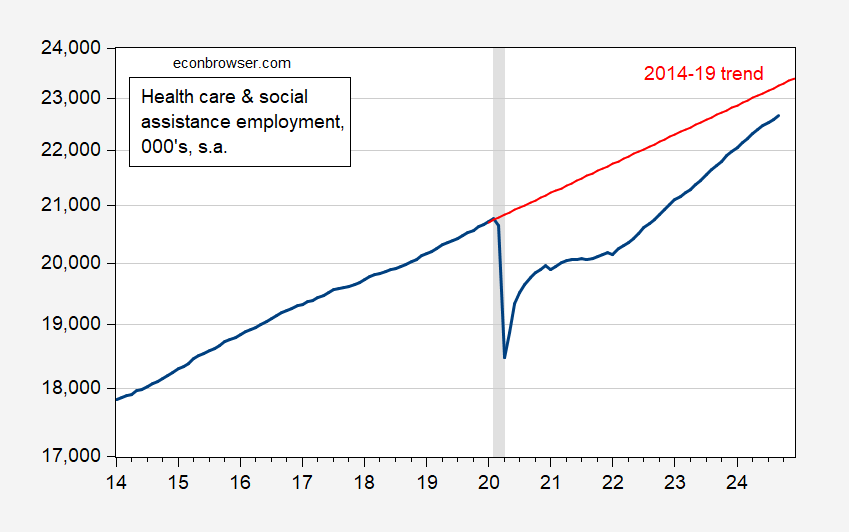
I’ll just point out that context is important. In addition to an aging population (ever have to deal with your parents’ health care and housing issues?), there was a big hit to the level of health care and social assistance employment during the pandemic, as shown in Figure 4.
Figure 4: Health care and social assistance employment (blue), and stochastic (log) trend estimated over 2014-19 period (red), all in 000’s, s.a. Plotted on log scale. NBER defined peak-to-trough recession dates shaded gray. Source: BLS, NBER, and author’s calculations.
Seems to me we have some catch-up to do on health care and social services employment, so maybe sustainable for some time?
Source link

