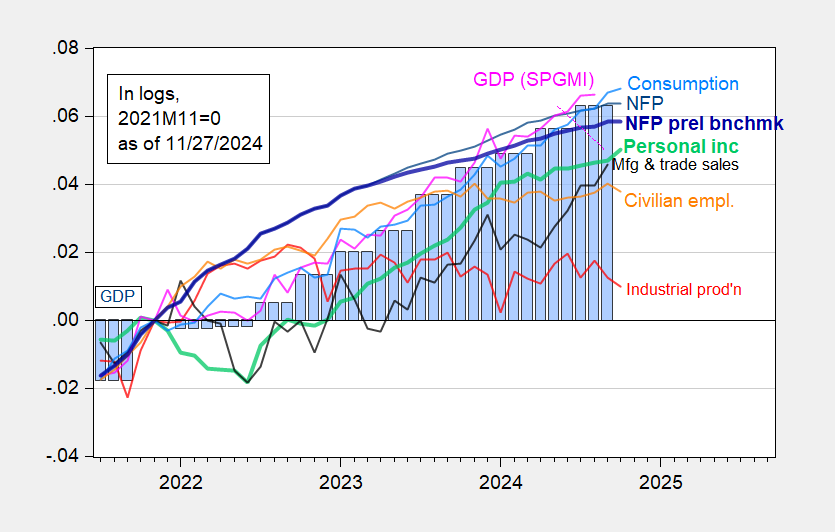
One of the last snapshots of the Biden economy show real consumption and personal income rising, with consumption rising 0.6% (vs. consensus of 0.3%), and faster than inflation. Here are some key indicators followed by the NBER’s Business Cycle Dating Committee.
Figure 1: Nonfarm Payroll (NFP) employment from CES (blue), implied NFP from preliminary benchmark (bold blue), civilian employment (orange), industrial production (red), personal income excluding current transfers in Ch.2017$ (bold light green), manufacturing and trade sales in Ch.2017$ (black), consumption in Ch.2017$ (light blue), and monthly GDP in Ch.2017$ (pink), GDP (blue bars), all log normalized to 2021M11=0. Source: BLS via FRED, Federal Reserve, BEA 2024Q3 2nd release, S&P Global Market Insights (nee Macroeconomic Advisers, IHS Markit) (11/1/2024 release), and author’s calculations.
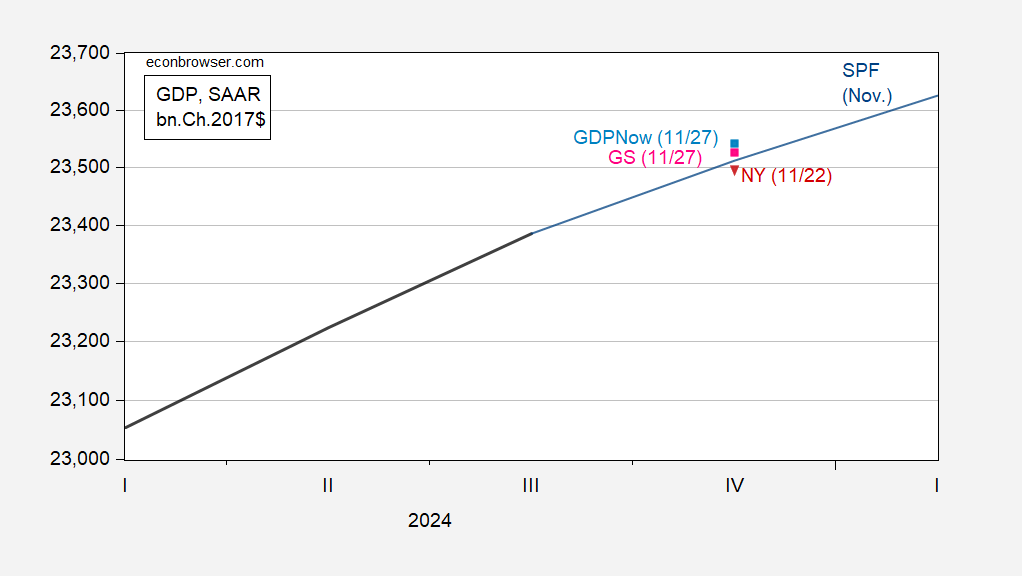
Nowcasts and tracking estimates for Q4 are largely unchanged. Here’re some nowcasts compared to the SPF November median.
Figure 2: GDP (bold black), Survey of Professional Forecasters November survey median (blue), GDPNow of 11/27 (light blue square), NY Fed nowcast of 11/22 (red triangle), and Goldman Sachs of 11/27 (pink square), all in bn.Ch.2017$ SAAR. Nowcast levels of GDP calculated by iterating nowcast growth rate on latest available GDP. Source: BEA 2024Q3 2nd release, Philadelphia Fed, NY Fed, Goldman Sachs and author’s calculations.
Finally, for high frequency indicators, the Lewis-Mertens-Stock Weekly Economic Index is at 1.8% for the week ending 11/23, while the Baumeister-Leon-Leiva-Sims WECI indicates -0.59%, which translates into 1.41% if trend growth is 2%, down from an implied 3.42% at June’s end.
In other words, there is little evidence of the recession that some observers have argued was in place from August. Rather, the Biden administration has bequeathed the American public a remarkably strong economy, with core PCE y/y inflation at 2.8%, and instantaneous PCE inflation at 2.4%.
Source link

