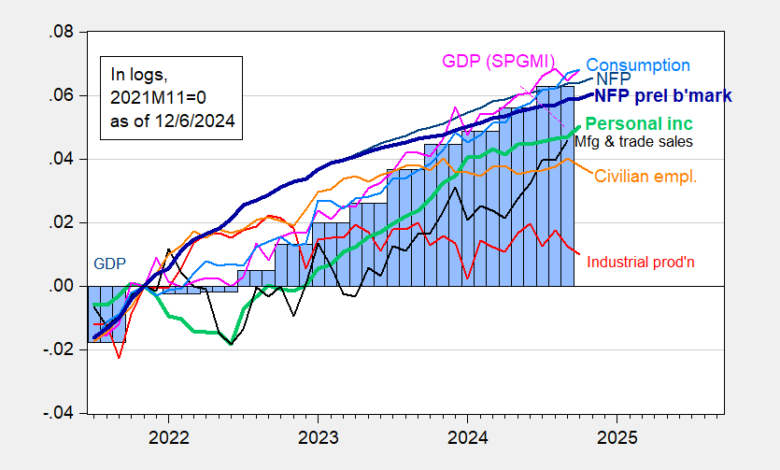
Here are some key indicators followed by NBER’s BCDC, including employment for November (227K vs. 202K consensus, 194K vs. 160K consensus, for NFP, and private NFP respectively).
Figure 1: Nonfarm Payroll (NFP) employment from CES (blue), implied NFP from preliminary benchmark (bold blue), civilian employment (orange), industrial production (red), personal income excluding current transfers in Ch.2017$ (bold light green), manufacturing and trade sales in Ch.2017$ (black), consumption in Ch.2017$ (light blue), and monthly GDP in Ch.2017$ (pink), GDP (blue bars), all log normalized to 2021M11=0. Source: BLS via FRED, Federal Reserve, BEA 2024Q3 2nd release, S&P Global Market Insights (nee Macroeconomic Advisers, IHS Markit) (12/2/2024 release), and author’s calculations.
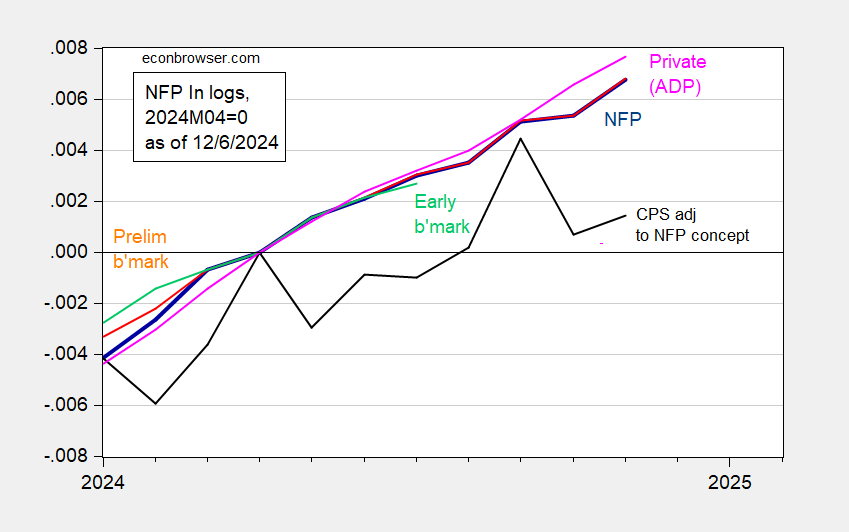
What about the reliability of employment data? Here’s some measures of employment from the two BLS surveys, and a measure of private NFP from ADP, all normalized to 2024M04=0 (DiMartino Booth asserts the recession started then).
Figure 2: Nonfarm Payroll (NFP) employment from CES (blue), from implied preliminary benchmark (orange), Philadelphia Fed early benchmark (light green), from CPS adjusted to NFP concept (black), private NFP from ADP-Stanford Digital Economic Lab (pink), all in logs 2024M04=0. Source: BLS, ADP via FRED, BLS, Philadelphia Fed, and author’s calculations.
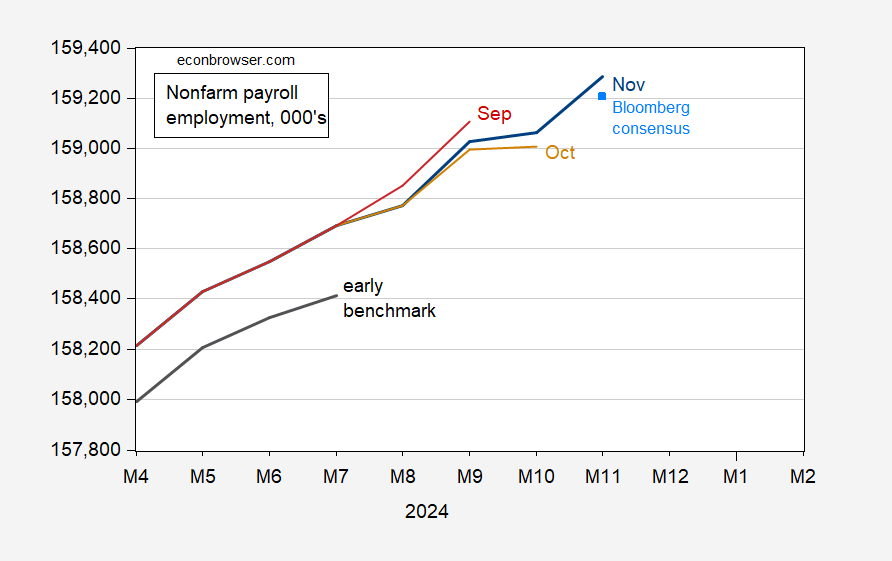
Here’s a picture of various vintages of NFP, compared to consensus, and early benchmark.
Figure 3: Nonfarm payroll employment, November release (blue), Bloomberg consensus of 12/5 (light blue square), October release (tan), September release (red), early benchmark (black). Bloomberg consensus NFP level calculated by iterating consensus growth on reported October release level. Early benchmark NFP calculated by applying ratio of early benchmark sum of states to CES sum of states to reported national NFP. Source: BLS, Philadelphia Fed, Bloomberg, author’s calculations.
Source link


