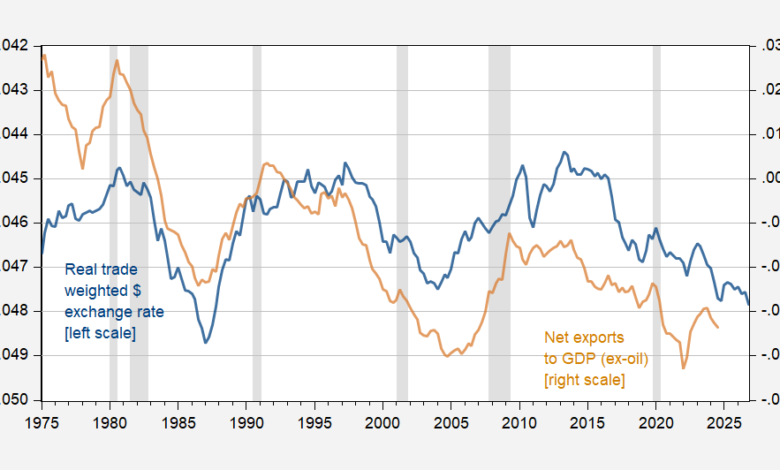
Paul Krugman writes on The Dollar and the US Trade Deficit today, and reminds me of my favorite graph (makes an appearance each time I teach macro, and a version shows up in Chapter 13 of Chinn-Irwin International Economics.
Figure 1: Log real trade weighted dollar exchange rate, lagged two years (blue, left scale), net exports ex-petroleum to GDP ratio (tan, right scale). An increase in the exchange rate series is a depreciation. NBER defined peak-to-trough recession dates shaded gray. Source: Federal Reserve, BEA via FRED, and NBER, and author’s calculations.
Figure 1 is actually a mashup of Krugman’s Figures 1 and 2, with the exchange rate series lagged two years.
So, in some ways the die is cast, if macro rules the trade balance…
Source link