A comparison:
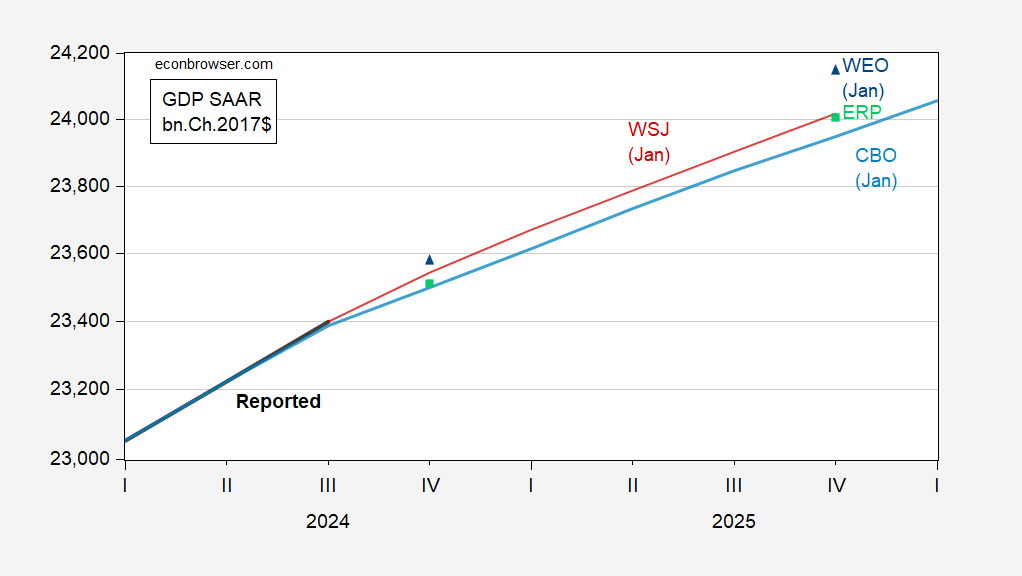
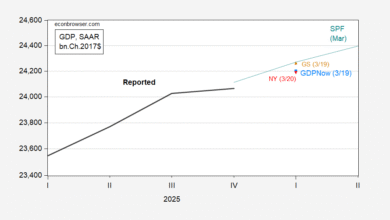
Figure 1: GDP (bold black), WSJ January survey mean (red), CBO January projection (light blue), Biden administration (light green), IMF WEO January forecast (blue triangle), all in billion Ch.2017$ SAAR. Source: BEA, WSJ, CBO, IMF, Economic Report of the President, 2025, and author’s calculations.
Note that CBO projects under current law, Troika typically on administration policies, IMF conditions on certain assumptions, and WSJ is mean of various forecaster assumptions.
Figure 2 displays the mean forecast and a measure of divergence (trimmed 20%):
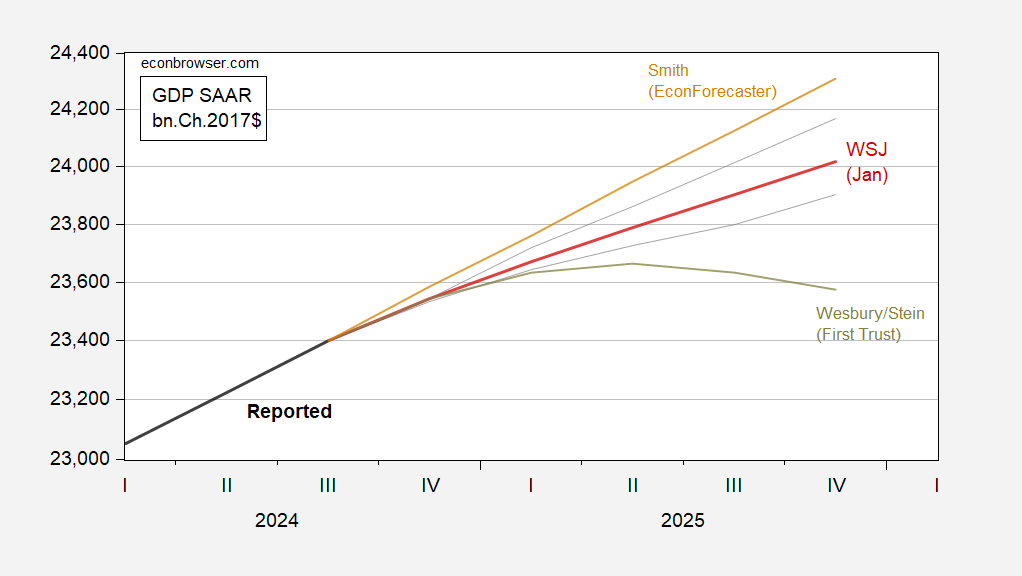
Figure 2: GDP (bold black), WSJ January survey mean (red), 20% trimmed hi, low for 2025 q4/q4 (gray lines), highest forecast (tan), lowest (gray green). Source: BEA, WSJ, and author’s calculations.
James F. Smith is (again) at the top (I want what he’s smoking!), while only one respondent is forecasting a downturn (Wesbury and Stein at First Trust). As far as I can make out, Mr. Wesbury’s and Mr. Stein’s forecast is based on a retrenchment in economic activity due to the excesses during the covid period.
Source link