Uncertainty from text analysis, and from consumer surveys:
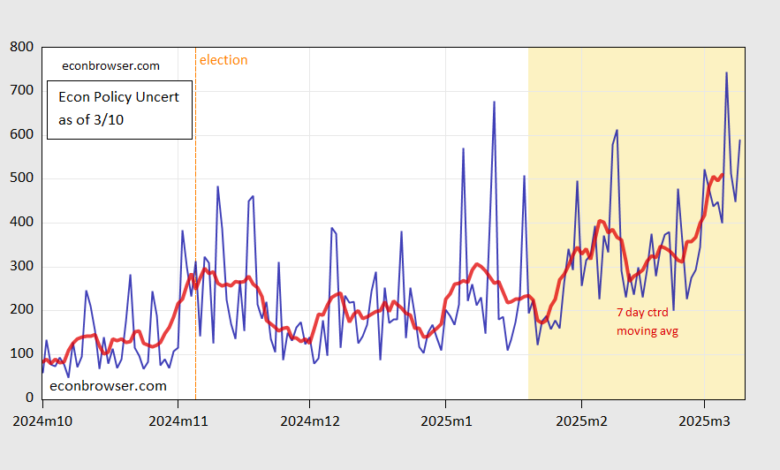
First economic policy uncertainty:
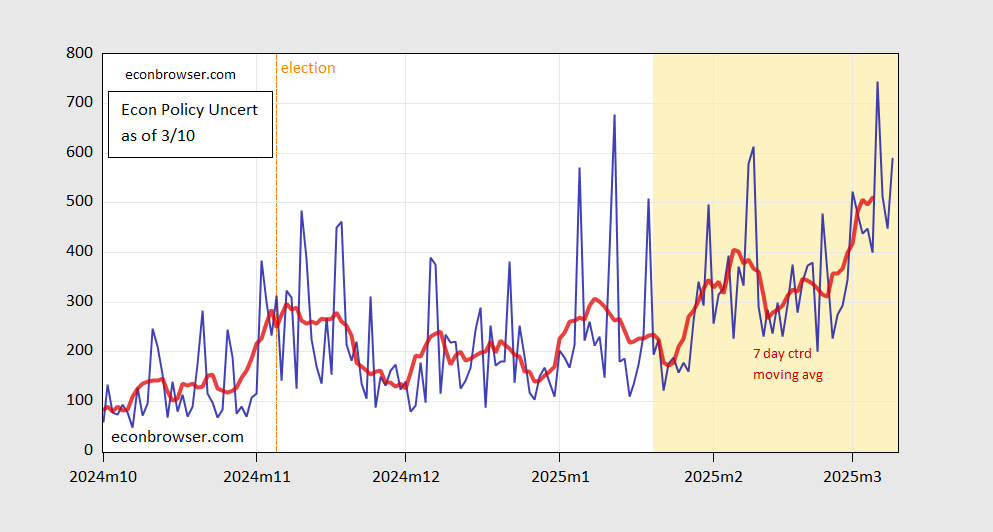
Figure 1: EPU (blue), and 7 day centered moving average (red). Source: policyuncertainty.com and author’s calculations.
Next, consider the newly released NY Fed measures of 1 year ahead expected inflation, and uncertainty.
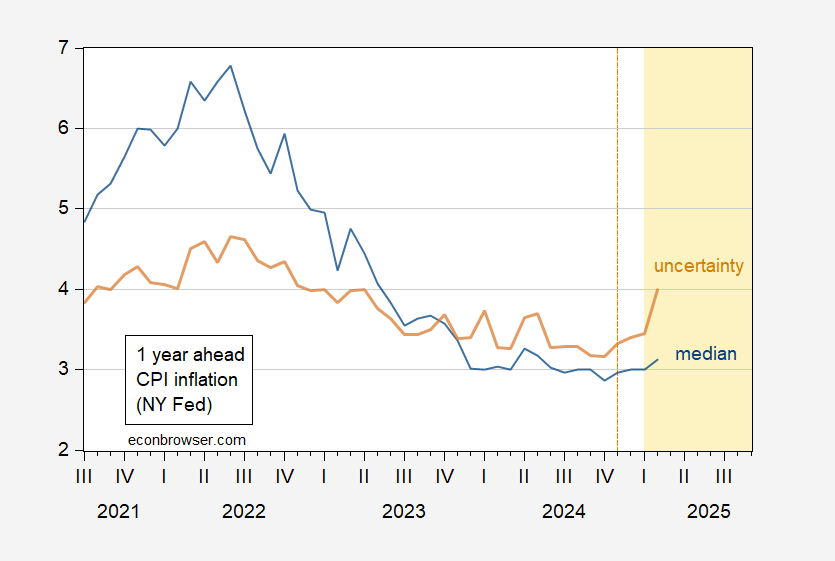
Figure 2: Median one year ahead inflation (blue), and associated uncertainty (brown). Source: NY Fed.
Third, even more interesting is how the “better off” a year ahead number (sum of much better off and somewhat better off) has evolved, vs. U.Michigan economic sentiment and Conference Board confidence.
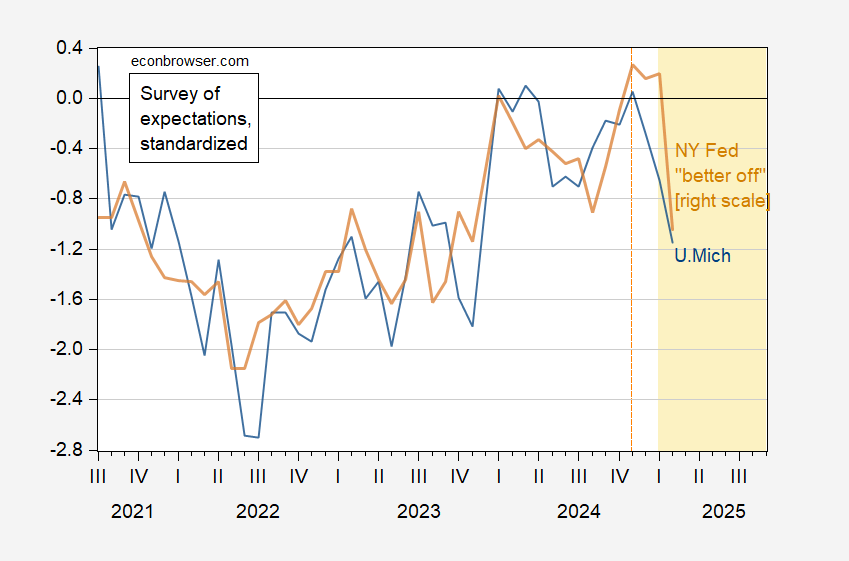
Figure 3: U. .Michigan survey median future expectations (blue, left scale), and NY Fed survey “better off in a year” (brown, right scale), both demeaned and divided by standard deviation 2013-2025. Source: U.Mich. via FRED, NY Fed, and author’s calculations.
Source link