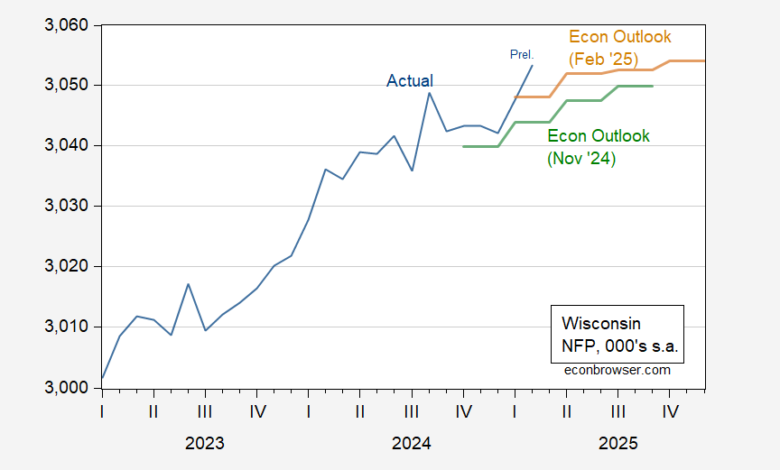
DWD released February employment numbers yesterday; DoR’s February Economic Outlook forecast was also published.
Figure 1: Wisconsin nonfarm payroll employment (blue), November 2024 DoR forecast (green), February 2025 DoR forecast (tan), all in 000’s, s.a. Source: BLS, DWD, DoR.
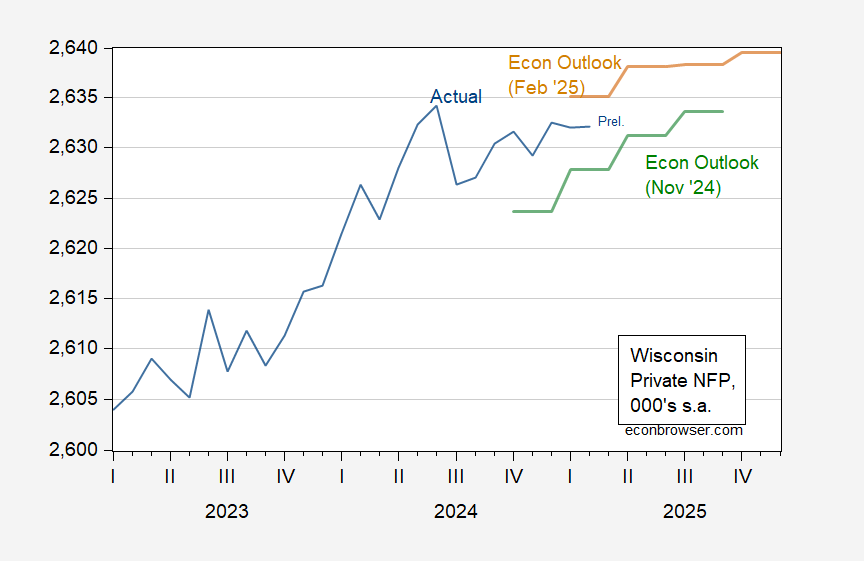
Figure 2: Wisconsin private nonfarm payroll employment (blue), November 2024 DoR forecast (green), February 2025 DoR forecast (tan), all in 000’s, s.a. Source: BLS, DWD, DoR.
How do the employment figures affect the overall picture for Wisconsin economic activity? Here’s a picture of multiple indicators, normalized to 2021M11.
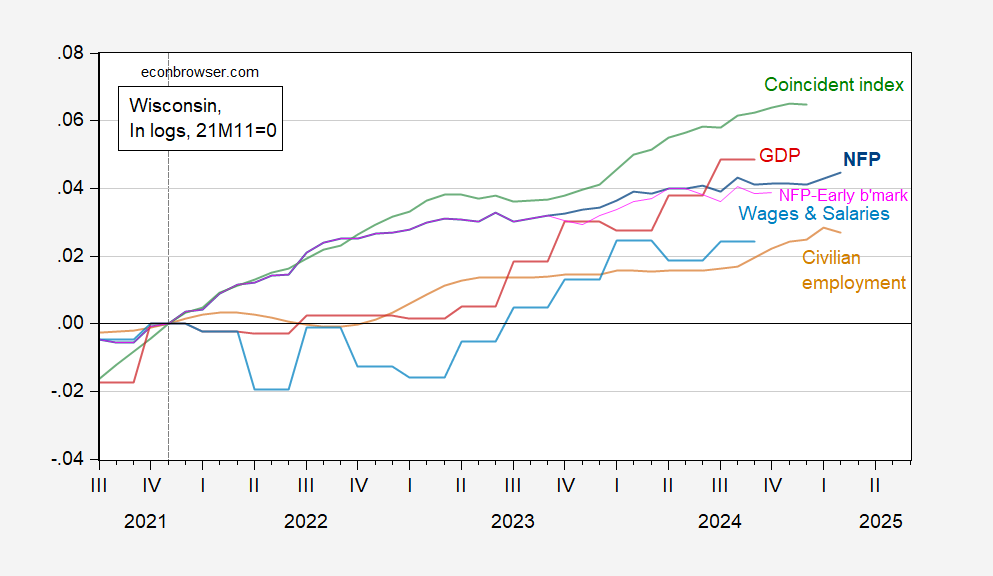
Figure 3: Wisconsin Nonfarm Payroll Employment (dark blue), Philadelphia Fed early benchmark measure of NFP (pink), Civilian Employment (tan), real wages and salaries, deflated by national chained CPI (sky blue), GDP (red), coincident index (green), all in logs 2021M11=0. Source: BLS, BEA, Philadelphia Fed [1], [2], and author’s calculations.
What about the outlook for GDP? I show reported Wisconsin real GDP, and the DoR’s forecast, against my forecast.
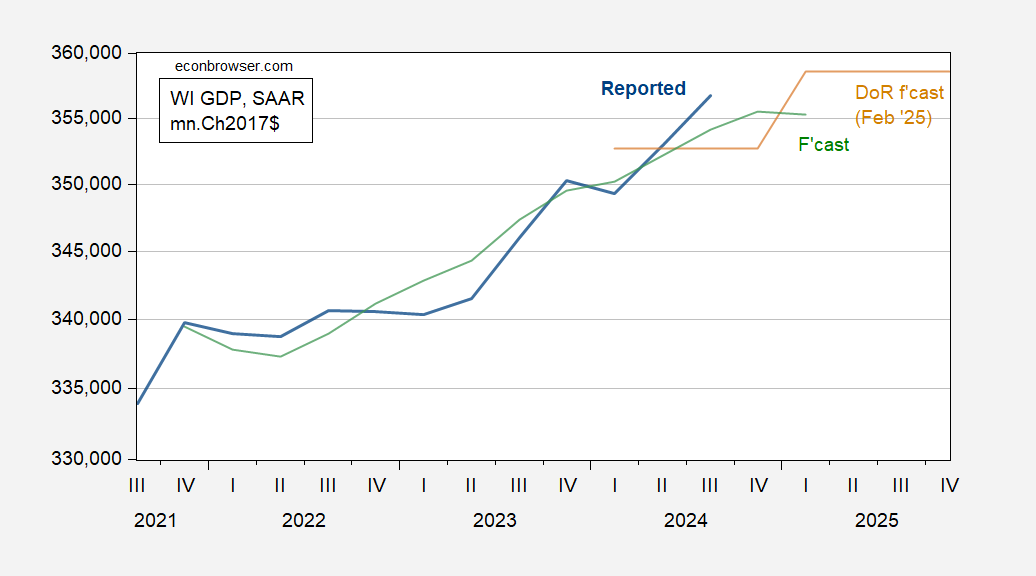
Figure 4: Wisconsin GDP (bold blue), DoR February forecast (tan), and forecast based on US GDP (green), all in mn.Ch.2017$ SAAR. Source: BEA, DoR, and author’s calculations.
My forecast is based on the relationship between WI GDP and US GDP (in log first differences) over 2021Q3-2024Q3, adjusted R2 = 0.50. The coefficient on US GDP is 1.05. I use GDPNow for Q1 to obtain the Q1 forecast for WI GDP Q1.
Interestingly, WI GDP in my forecast is essentially flat for Q1.
Source link