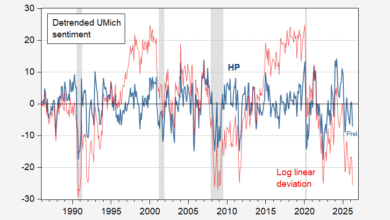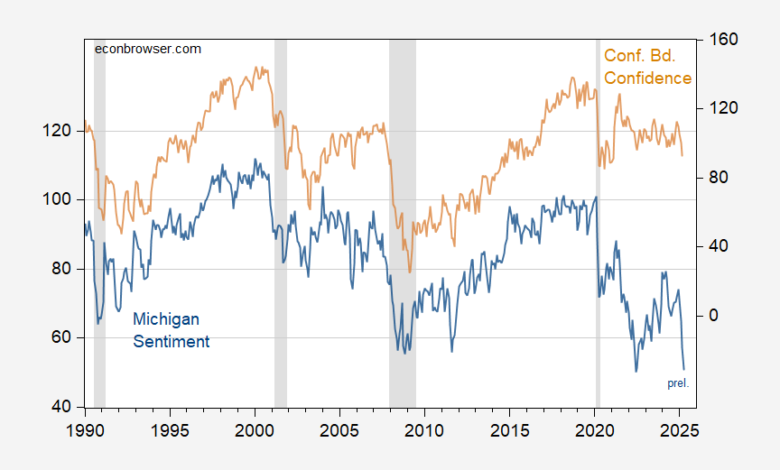
The current reading of 50.8 is below the 73.4 average reading over NBER peak-to-trough recessions dates (1990M01-2025M03):
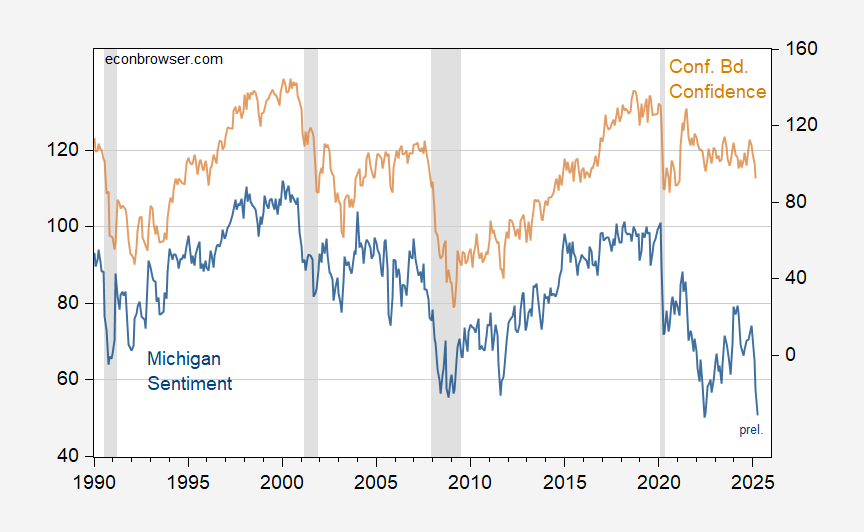
Figure 1: University of Michigan Consumer Sentiment (blue, left scale), and Conference Board Consumer Confidence (tan, right scale). NBER defined peak-to-trough recession dates shaded gray. Source: U.Michigan, Conference Board, NBER.
The same is not true for the Conference Board’s Consumer Confidence measure, at least for March at 92.9 (recession average is 75).
Another way of tackling the question is to use a probit regression to see if contemporaneous values of the Michigan Confidence index predicts (not forecasts) recession.
I estimate over 1990-2025M03 a probit regression of a recession dummy on U.Michigan Sentiment, assuming no recession has occurred through March 2025.
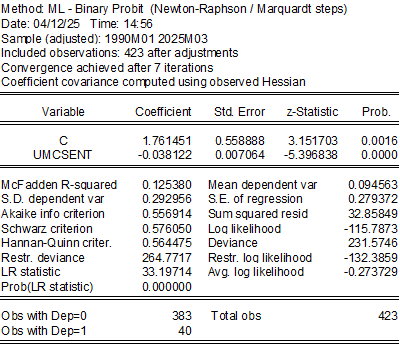
The estimated recession probabilities are shown in blue in Figure 2 below.
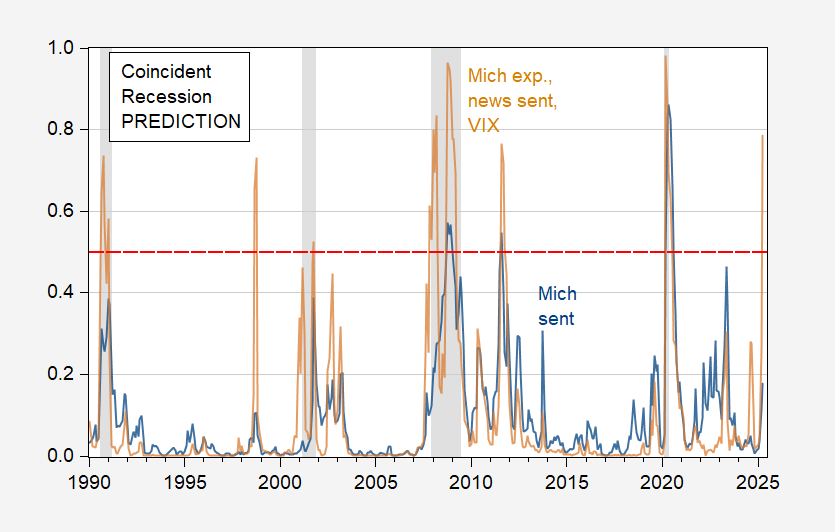
Figure 2: Estimated recession probability from probit regression on Michigan Sentiment (blue), and on Michigan Sentiment, News Sentiment, 1yr-FFR spread, VIX (tan). April data is for news through 4/6, interest rates and VIX through 4/11. NBER defined peak-to-trough recession dates shaded gray. Source: NBER and author’s calculations.
The simple probit indicates a low probability of recession as of April. The pseuo-R2 is fairly low, so it makes sense to use other soft data and financial data. I substitute expectations, and augment the that index with the SF Fed’s News Sentiment index, the 1yr-Fed funds spread (per Miller 2019) for near horizon recession probabilities) and the VIX.
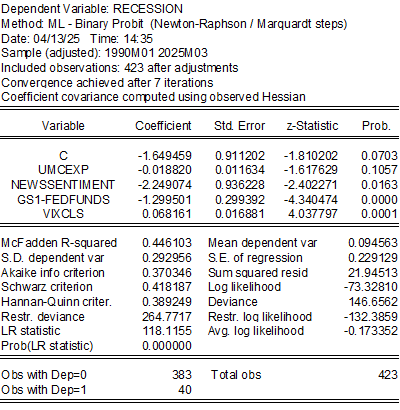
The pseudo-R2 is substantially higher now, while the expectations variable is not as statistically significant. The spread and VIX both enter significantly. The estimated recession probabilities are shown as the tan line, with a value of 77.6% in April. This model has two false positives, and no missed positives.
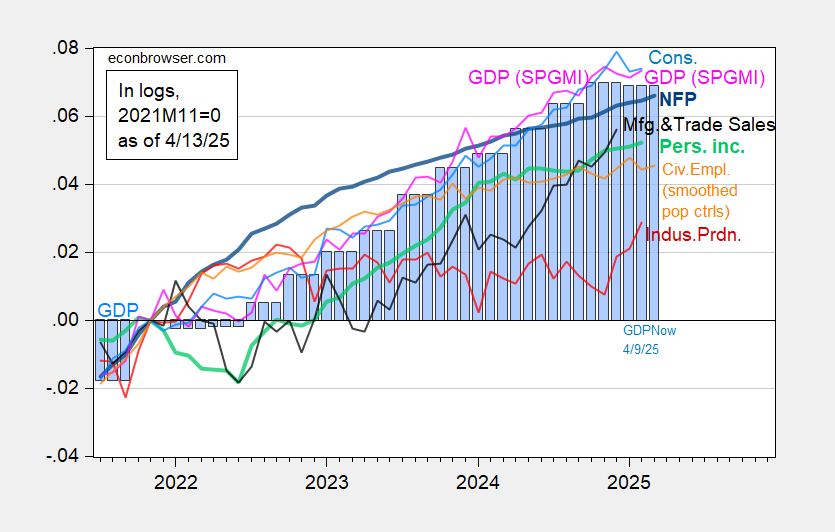
Figure 3: Nonfarm Payroll incl benchmark revision employment from CES (bold blue), civilian employment experimental series incorporating smoothed population controls, spliced to official (orange), industrial production (red), personal income excluding current transfers in Ch.2017$ (bold light green), manufacturing and trade sales in Ch.2017$ (black), consumption in Ch.2017$ (light blue), and monthly GDP in Ch.2017$ (pink), BEA GDP (blue bars), and GDPNow as of 4/9 (blue bars 2025M01-M03, all log normalized to 2021M11=0. Source: BLS via FRED, Federal Reserve, BEA 2024Q4 3rd release, S&P Global Market Insights (nee Macroeconomic Advisers, IHS Markit) (4/1/2025 release), Atlanta Fed, and author’s calculations.
NFP up, civilian employment and monthly GDP trending sideways, consumption down, and Q1 GDPNow is flat vs. Q4.
Source link