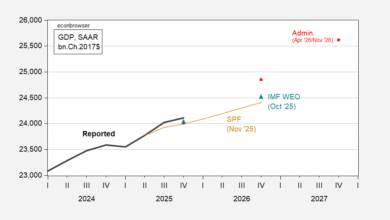
Survey results here, FT article . GDP level more optimistic than May SPF.
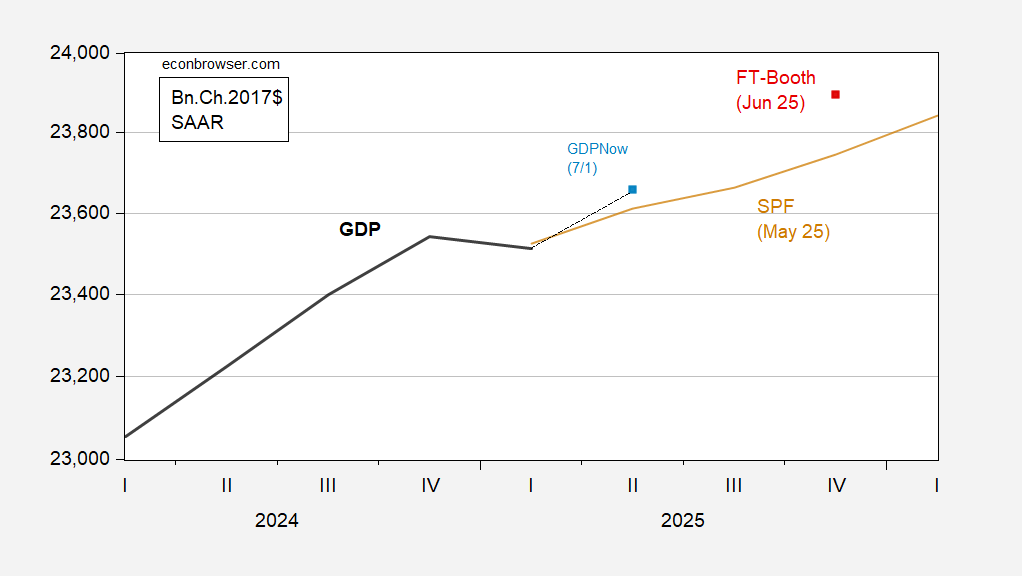
Figure 1: GDP (bold black), FT-Booth June 2025 survey median (red square), GDPNow of 7/1 (light blue square), Survey of Professional Forecasters May 2025 survey median (tan line), all in bn.Ch.2017$ SAAR. Source: BEA 2025Q1 3rd release, FT-Booth June survey, Atlanta Fed, Philadelphia Fed, and author’s calculations.
Note that the FT-Booth survey is considerably more optimistic regarding the level of GDP than the May SPF median.
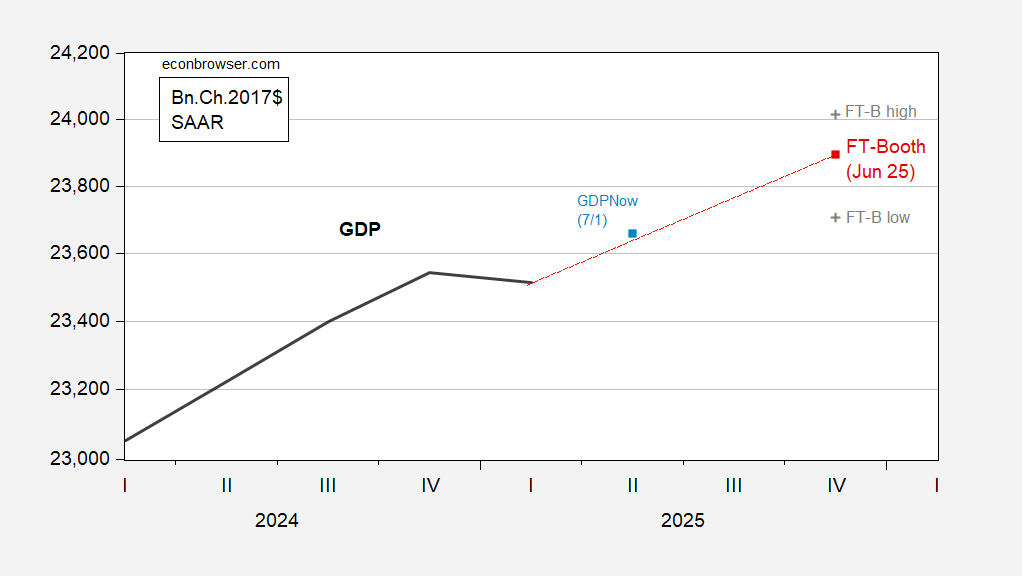
Figure 2: GDP (bold black), FT-Booth June 2025 survey median (red square), 10th percentile (gray +) 90th percentile (gray+), GDPNow of 7/1 (light blue square), all in bn.Ch.2017$ SAAR. Source: BEA 2025Q1 3rd release, FT-Booth June survey, Atlanta Fed,and author’s calculations.
While the FT-Booth median is above the May SPF median, the 10/90 percentile band encompasses the SPF.
The FT-Booth survey respondents seem to think a recession has been moved back (2026q3 or later has risen from 39% in March to 45% in June.
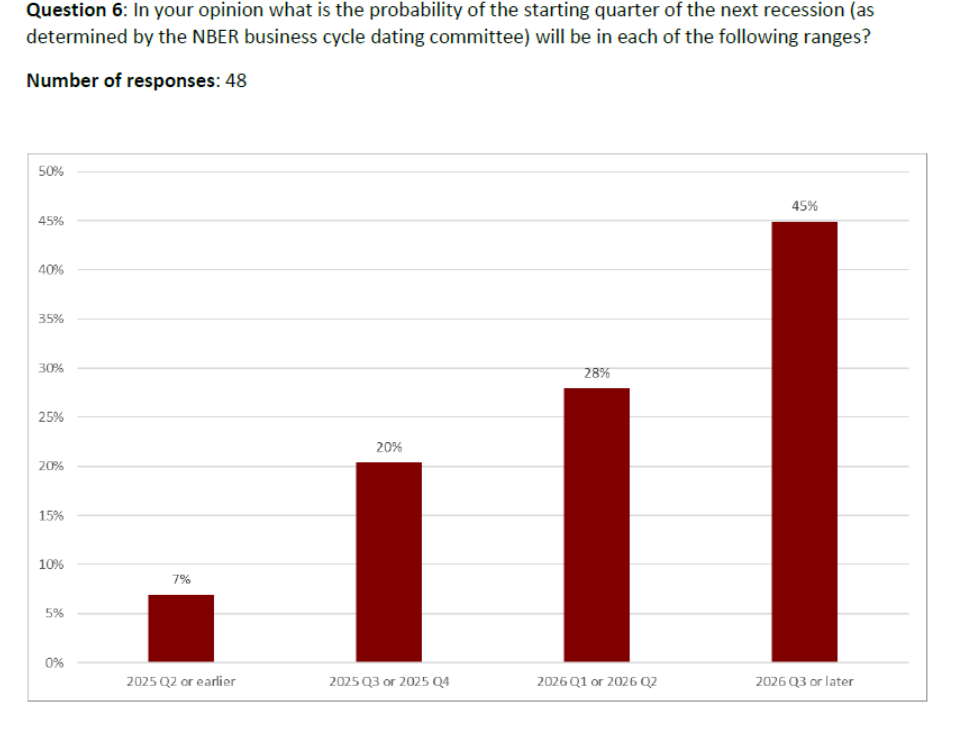
My modal response was 2026Q1-Q2.
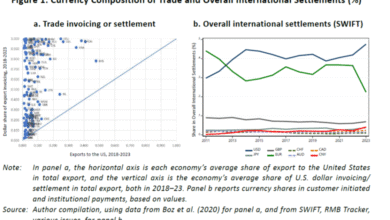
The macroeconomists were also queried about the prospects for the dollar’s safe haven aspect.

I’m one of the 32%.
Finally, with respect to economic data collection.
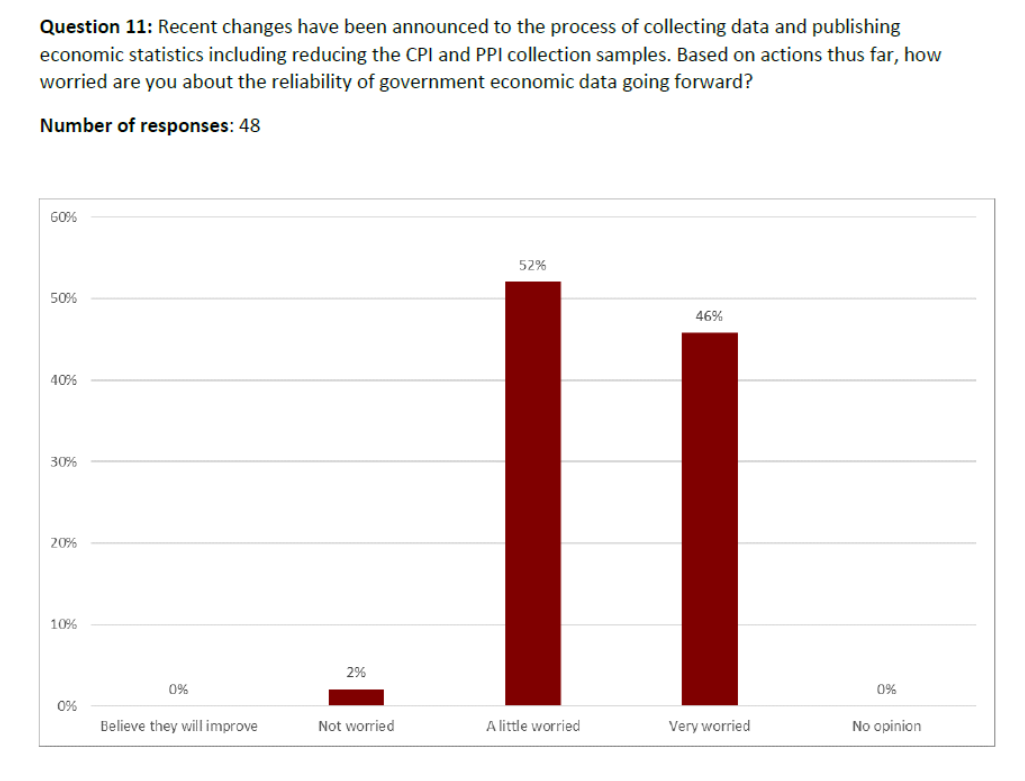
Interestingly, a lot of macroeconomists are concerned about degradation of the series the BLS collects regarding prices. I would’ve thought the proportion would be higher for “very worried”, but at least nobody was delusional enough to “believe they will improve”. Given that the CPI enters into everything from Social Security benefit calculations to TIPS yields, we should all be concerned.
Source link