As of today:
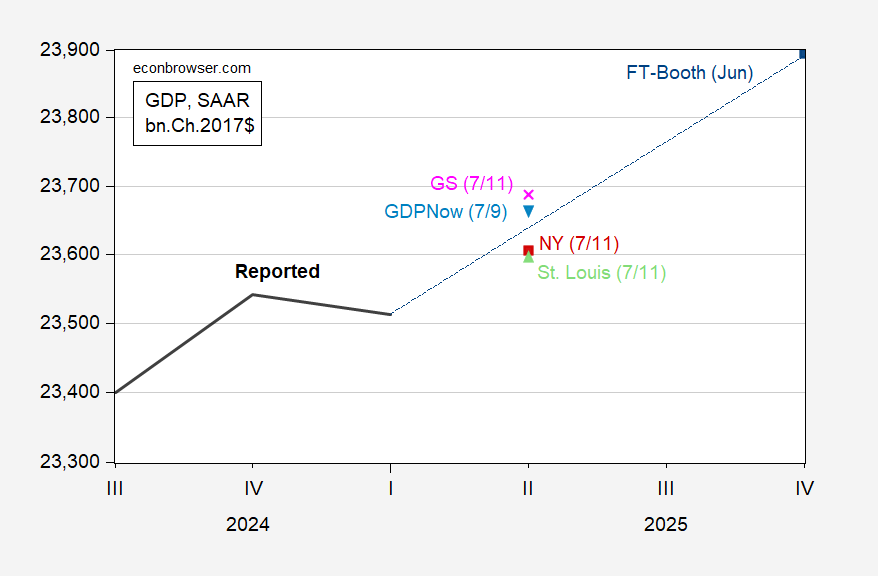
Figure 1: GDP (bold black), GDPNow of 7/9 (light blue inverted triangle), NY Fed nowcast of 7/11 (red square), St. Louis Fed news nowcast of 7/11 (light green triangle), Goldman Sachs of 7/11 (pink x), FT Booth June survey median (blue square), all in bn.Ch.2017$ SAAR. Source: BEA, Atlanta, NY, St. Louis Feds, Goldman Sachs, FT-Booth, and author’s calculations.
The Atlanta Fed nowcast (GDPNow) is a bottom up (component by component forecast), while the NY Fed nowcast is top down. The St. Louis index uses data surprises to generate the nowcast of aggregate GDP growth. Given the nature of the distortions attendant tariff front-loading, I would put more weight on the Atlanta Fed nowcast (it predicted negative growth, while the NY Fed and St. Louis Fed nowcasts predicted positive).
Final sales to private domestic purchasers (aka “core GDP”) should be less sensitive to distortions.
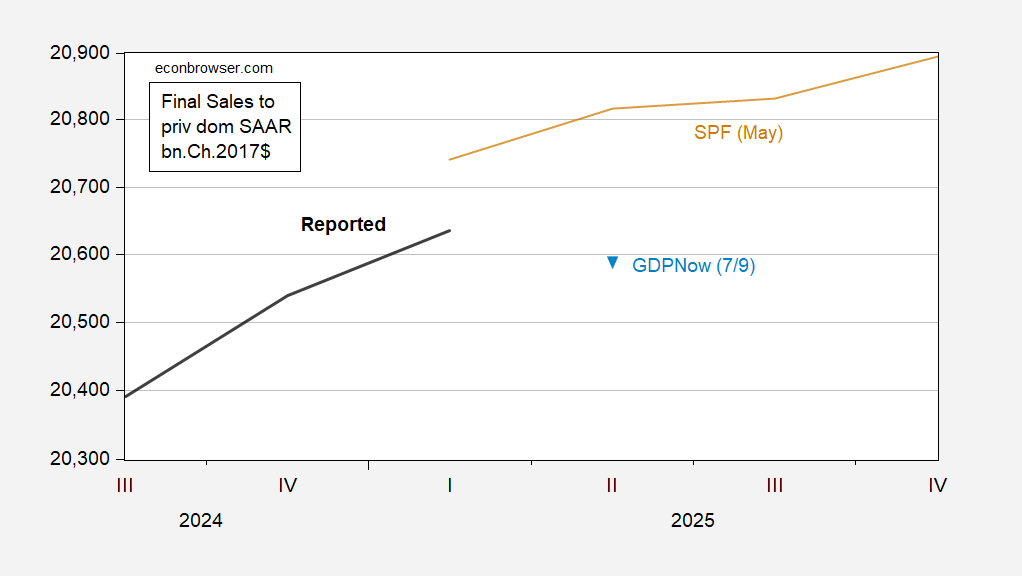
Figure 2: Final sales to private domestic purchasers (bold black), GDPNow of 7/9 (light blue inverted triangle), in bn.Ch.2017$ SAAR. Source: BEA, Atlanta Fed, and author’s calculations.
The Atlanta Fed nowcasts a slight decline (0.9% annualized) in final sales to private domestic purchasers. As is, reported sales are far below the median forecast of the May Survey of Professional Forecasters.
Source link