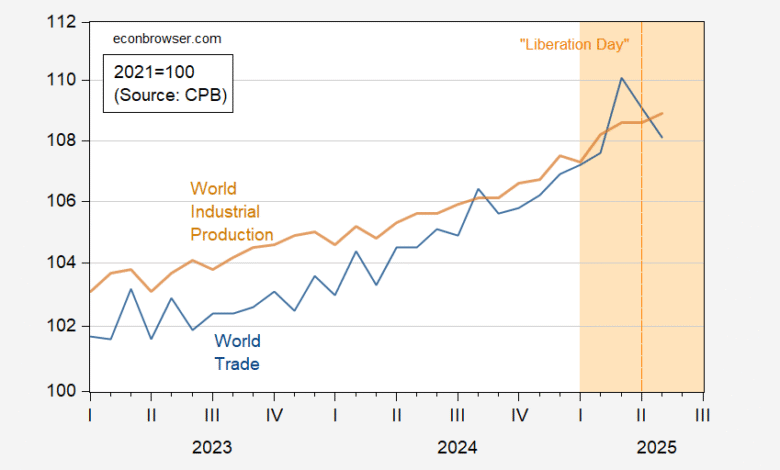
From CPB, data through May:
Figure 1: World Trade Volume (blue), World Industrial Production (tan), both 2006=100., on log scale. Light orange shading denotes Trump 2.0 administration. Orange dashed line at “Liberation Day”. Source: Central Plaanbureau.
There’s a drop in May as tariff-front running ended. We need June’s data for some clarity.i
When (Trump) Tariffs last bloomed:
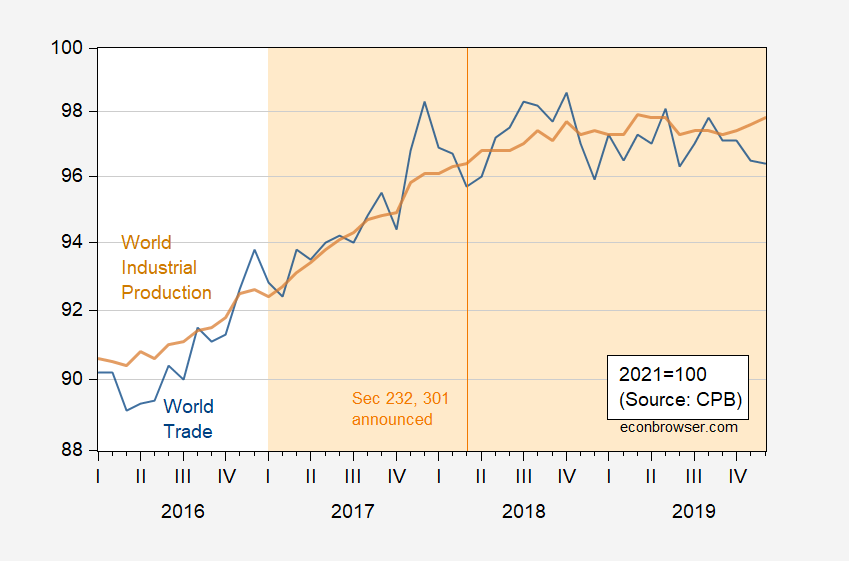
Figure 2: World Trade Volume (blue), World Industrial Production (tan), both 2006=100., on log scale. Light orange shading denotes Trump 1.0 administration. Orange dashed line at notice of intent to impose Section 232, 301 tariffs. Source: Central Plaanbureau.
By the way, as everybody is hailing the “deal” with Europe (All those investments! All those purchases of energy products!), just remember the sorry implementation record of the Trump US-China Economic and Trade agreement, Phase 1.
US exports are shown in this post, for Q1, and nowcast for Q2.
Source link