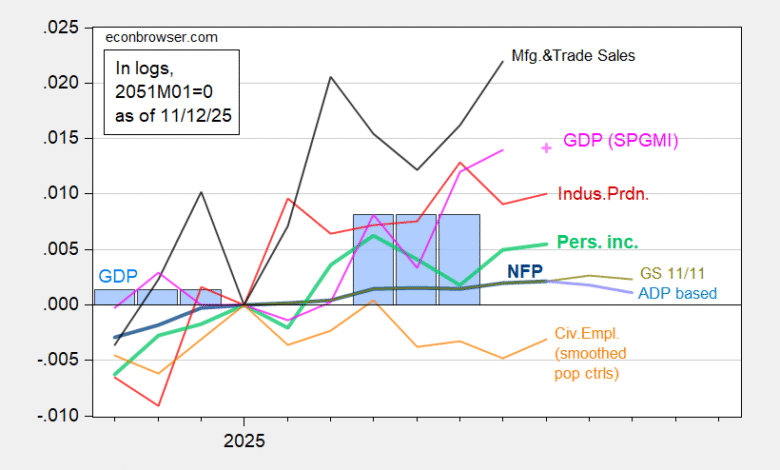
Key indicators, and my guesses:
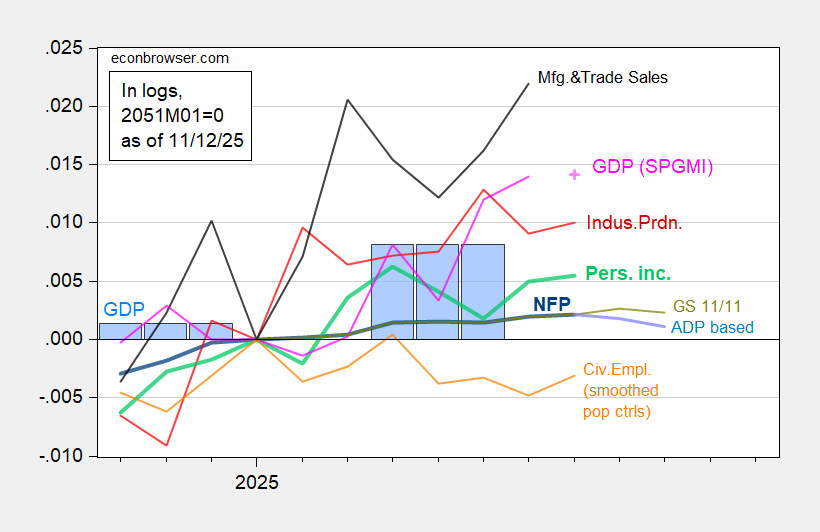
Figure 1: Implied NFP preliminary benchmark revision (bold dark blue), ADP implied NFP (light blue), Goldman Sachs implied (chartreuse), civilian employment with smoothed population controls, (bold orange), industrial production (red), personal income excluding current transfers in Ch.2017$ (bold light green), manufacturing and trade sales in Ch.2017$ (black), consumption in Ch.2017$ (light blue), and monthly GDP in Ch.2017$ (pink), extrapolated monthly GDP using Philadelphia Fed Coincident Index (pink +), GDP (blue bars), all log normalized to 2025M01=0. Source: BLS via FRED, Federal Reserve, BEA 2025Q2 third release, S&P Global Market Insights (nee Macroeconomic Advisers, IHS Markit) (9/2/2025 release), and author’s calculations.
I explain my method for nowcasting employment here. SPGMI’s monthly GDP is extrapolated one period using a regression of monthly GDP on coincident index 2022-2025, with a AR(1).
Source link