We have alternative readings on employment, compared to CES series.
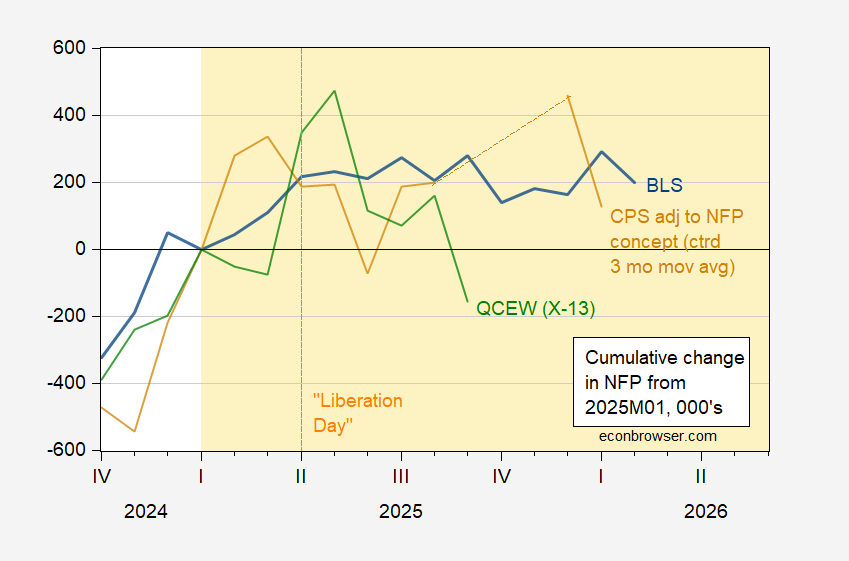
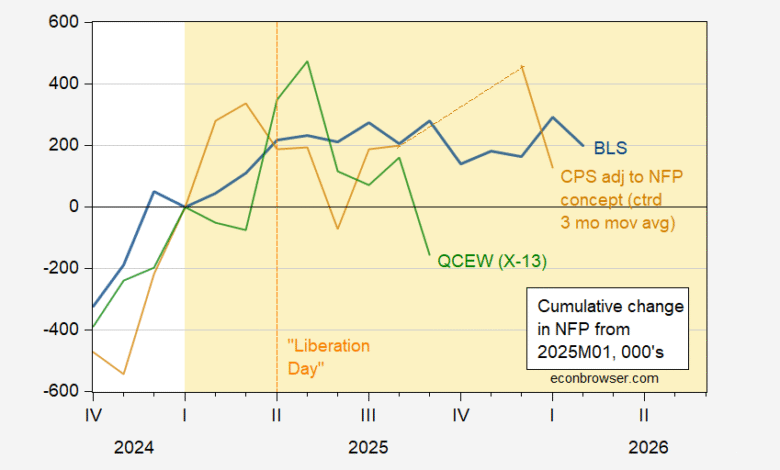
Figure 1: Change since 2025M01 in CES Nonfarm Payroll employment (blue), QCEW Nonfarm Payroll covered employment, seasonally adjusted by author using X-13 (green), and CPS employment adjusted to NFP concept (brown). Source: BLS via FRED, BLS, BLS/QCEW and author’s calculations.

Figure 2: Change since 2025M01 in CES Private Nonfarm Payroll employment (blue), QCEW Private Nonfarm Payroll covered employment, seasonally adjusted by author using X-13 (green), and ADP NFP (red). Source: BLS, ADP via FRED, BLS/QCEW and author’s calculations.
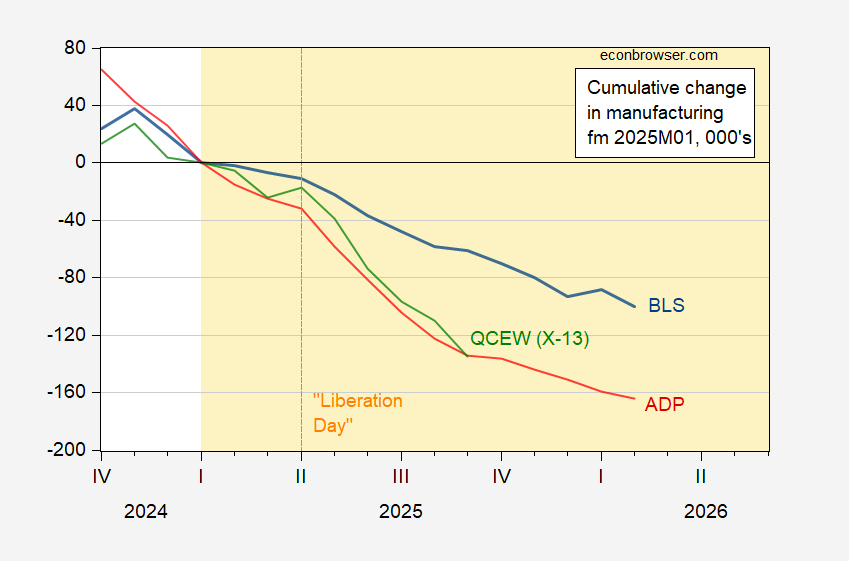
Figure 3: Change since 2025M01 in CES manufacturing employment (blue), QCEW manufacturing employment, seasonally adjusted by author using X-13 (green), and ADP manufacturing employment (red). Source: BLS, ADP via FRED, BLS/QCEW and author’s calculations.
If one is worried about the application of Census X-13 to aggregate employment, one can refer to year-on-year changes in n.s.a. QCEW series. Figure 4 shows this comparison for private nonfarm payroll employment.
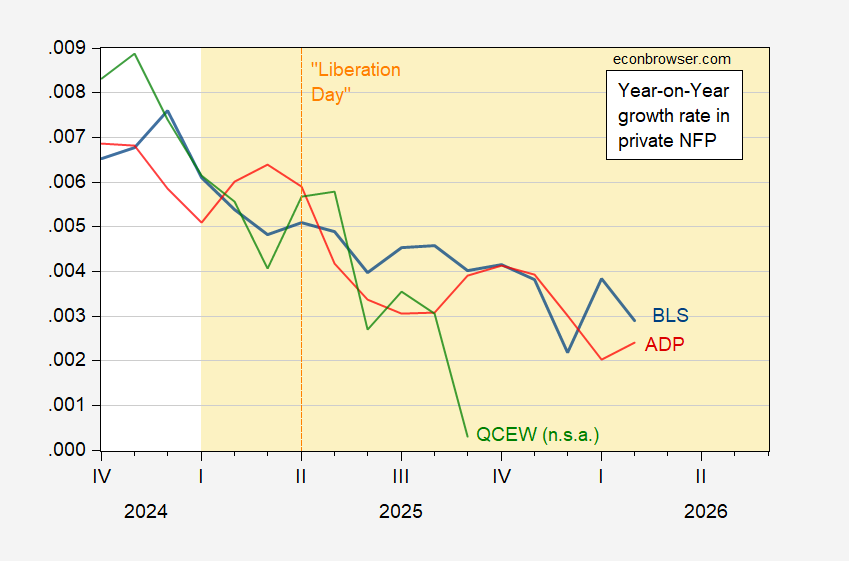
Figure 4: Year-on-Year growth rates in CES Private Nonfarm Payroll employment (blue), QCEW Private Nonfarm Payroll covered employment, n.s.a. (green), and ADP NFP (red). Source: BLS, ADP via FRED, BLS/QCEW and author’s calculations.
Bottom line: The census indicates employment in total NFP or private NFP have fallen relative to January 2025, as of September. This contrasts with CES based series indicating a modest increase.
Manufacturing employment as measured by the QCEW and ADP is decreasing faster than indicated in the CES series. That decline accelerated in the wake of “Liberation Day”.
Source link