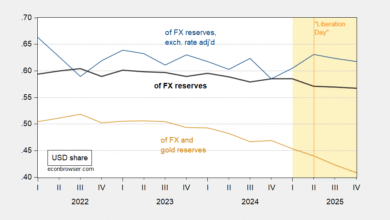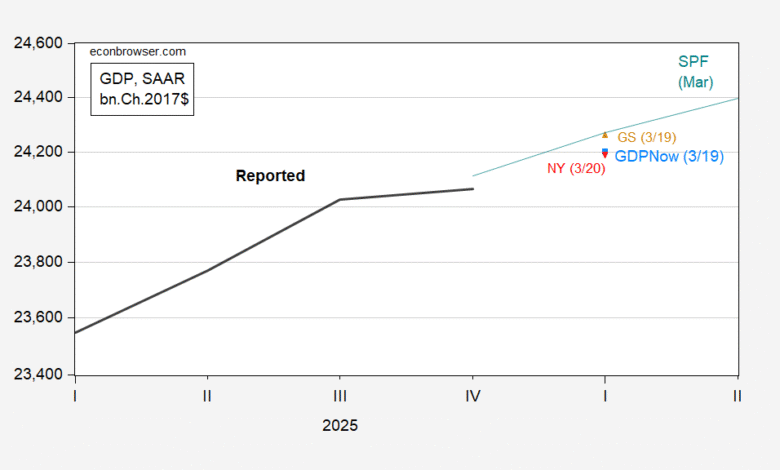
Nowcasts are typically below pre-war forecasts.
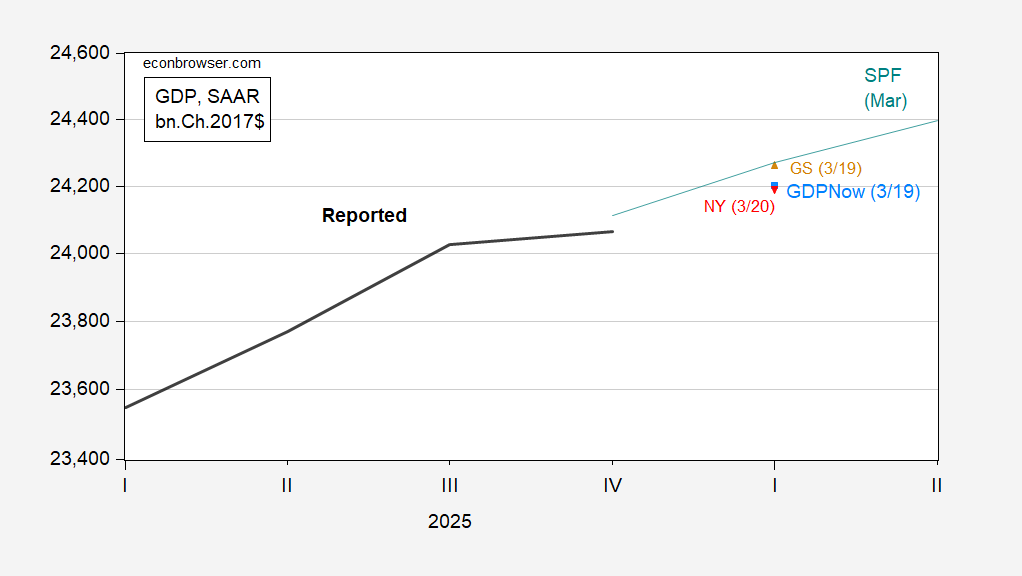
Figure 1: GDP as reported (bold black), March SPF (teal), Goldman Sachs tracking (light brown triangle), GDPNow (sky blue square), NY Fed nowcast (inverted red triangle), all in bn.Ch.2017$ SAAR, all on log scale. Source: BEA 2025Q4 2nd release, Philadelphia Fed, Goldman Sachs, Atlanta Fed, NY Fed, and author’s calculations.
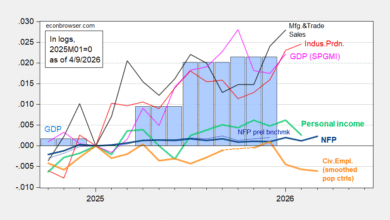
Most of the responses to the March Survey of Professional Forecasters were submitted before the beginning of the US-Israel-Iran war, so can be considered to some degree a pre-war outlook. The WSJ and FT-Booth forecasts for Q4 can be considered then downward revisions to the pre-war outlook.
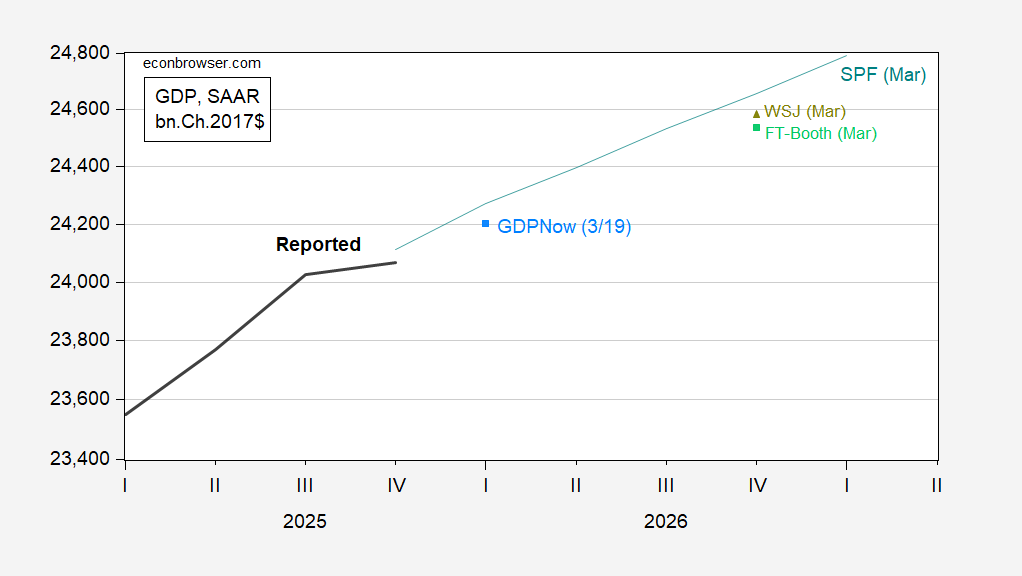
Figure 2: GDP as reported (bold black), March SPF (teal), GDPNow (sky blue square), March WSJ survey mean (chartreuse triangle), FT-Booth March survey median (light green square), all in bn.Ch.2017$ SAAR, all on log scale. Source: BEA 2025Q4 2nd release, Philadelphia Fed, WSJ, FT-Booth Survey of Macroeconomists, and author’s calculations.
I’ll note that the WSJ survey mean, taken a week ago or so, so incorporating knowledge of the war’s onset, does not indicate recession. Indeed, no respondent indicates negative Q4/Q4 growth for 2026.
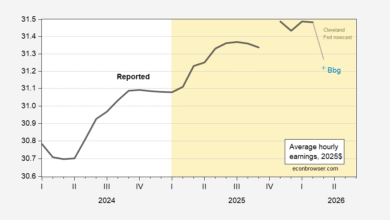
That being said, there is a certain softness indicated by nowcasts of final sales to private domestic purchasers (aka “core GDP”).
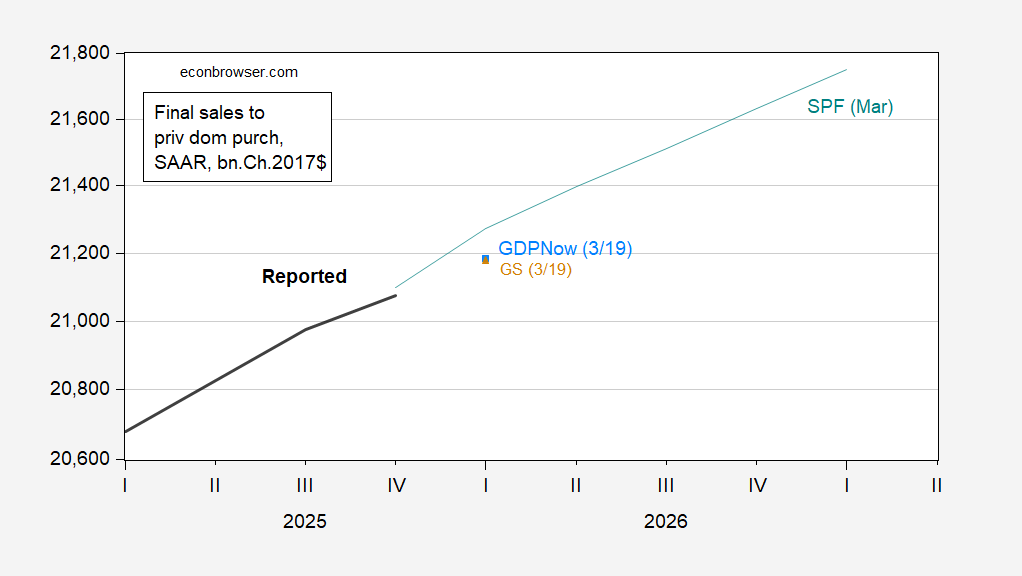
Figure 3: Final sales to private domestic purchasers as reported (bold black), March SPF (teal), GDPNow (sky blue square), GS (light brown triangle), all in bn.Ch.2017$ SAAR, all on log scale. Source: BEA 2025Q4 2nd release, Philadelphia Fed, WSJ, FT-Booth Survey of Macroeconomists, and author’s calculations.
Source link