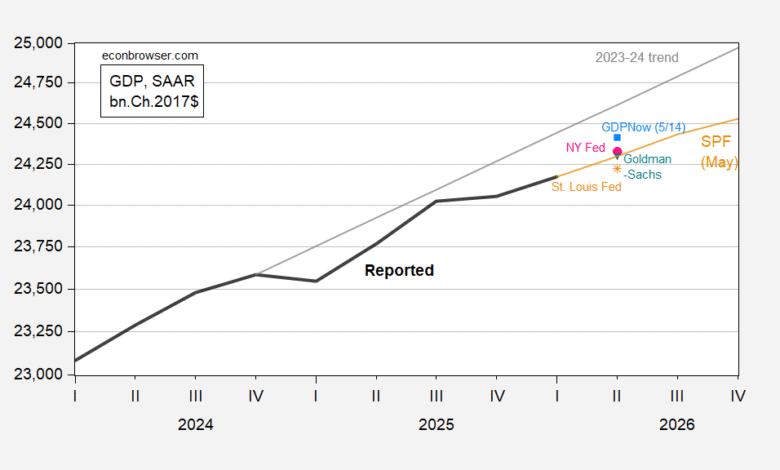
For Q2, GDPNow (q/q AR) is at 4%, while St Louis Fed is at 0.8%.
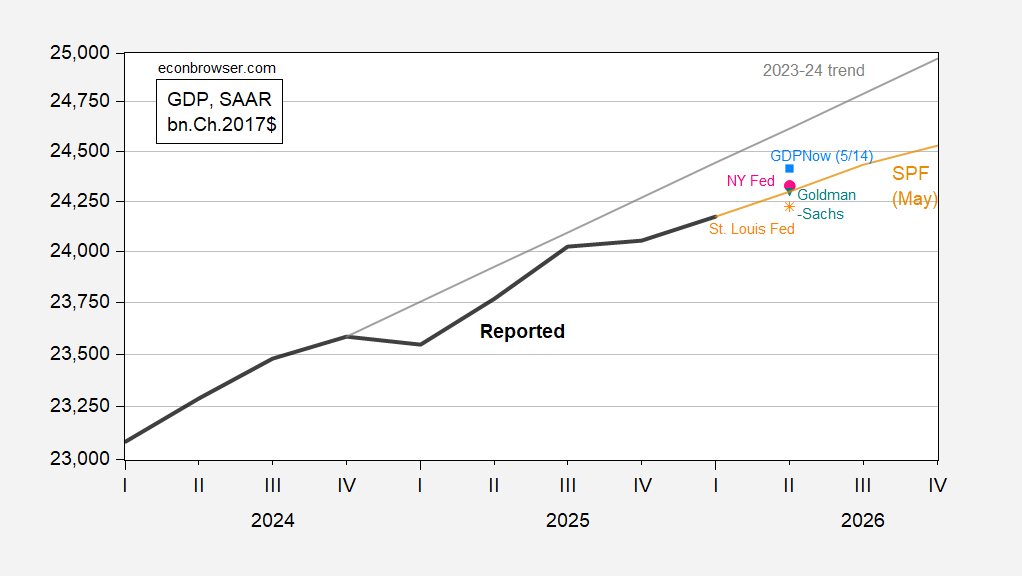
Figure 1: GDP (bold black), GDPNow (light blue square), NY Fed of 5/15 (pink circle), Goldman Sachs of 5/15 (teal inverted triangle), St.Louis Fed news of 5/15 (orange *), May Survey of Professional Forecasters (tan), 2023-24 stochastic trend (gray). Sources: BEA 2026Q1 advance, Atlanta Fed, NY Fed, Goldman Sachs, St. Louis Fed, Philadelphia Fed, and author’s calculations.
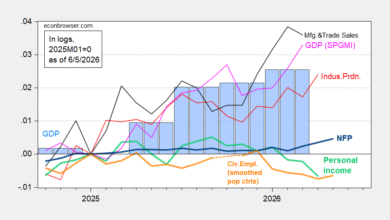
Due to trade shocks, it makes sense to also view proxy measures for aggregate demand; for discussion of why final sales to private domestic purchasers might be a preferable measure of the trajectory of output, see this post. Final sales to private domestic purchasers (aka “core GDP”) is shown below.
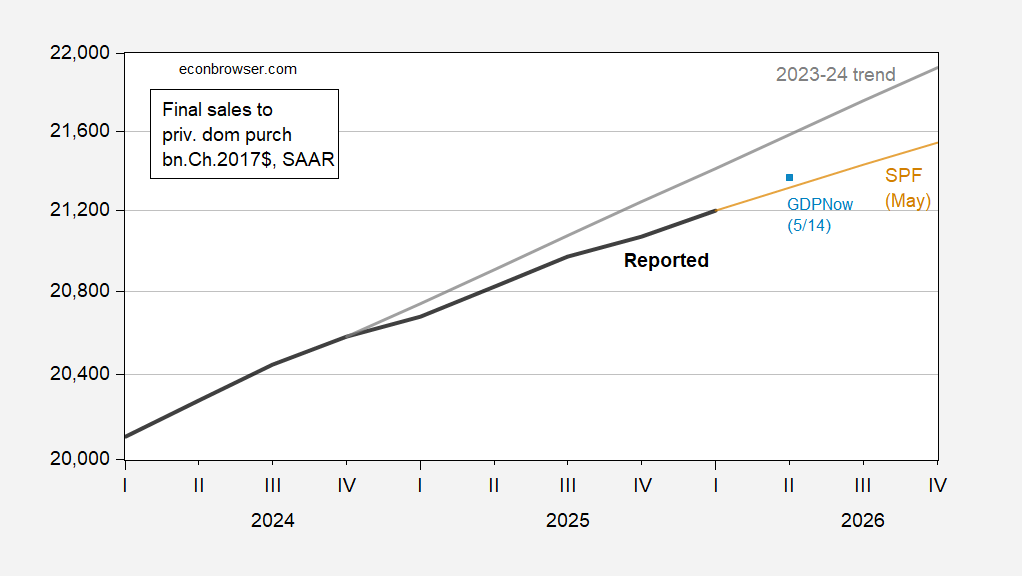
Figure 2: Final sales to private domestic purchasers (bold black), GDPNow estimate (light blue square), May Survey of Professional Forecasters (tan), 2023-24 stochastic trend (gray). Note: the sum of SPF consumption, nonresidential and residential fixed investment adjusted to sum to BEA reported final sales to private domestic purchasers (ratio of 0.9964). Sources: BEA 2026Q1 advance, Atlanta Fed, Philadelphia Fed, and author’s calculations.
So far, nowcasted “core GDP” is growing at 3.1% q/q AR, compared to 2.1% indicated by the Survey of Professional Forecasters.
Hence, with some releases encompassing data up to April (retail sales, employment) and most of the releases through March (international trade, construction spending), it appears that core GDP continues to grow.
Source link