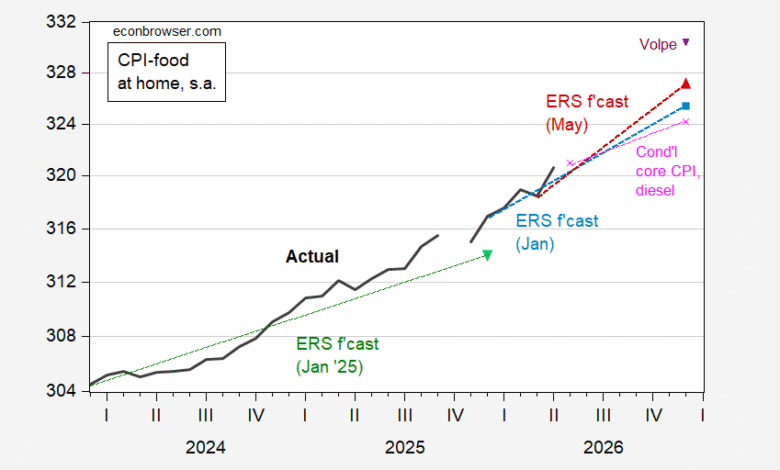
This Bloomberg article spurred me to update yesterday’s post:
A combination of factors including bad weather, tariffs and a dwindling cattle herd are already pushing up grocery prices at an above-average pace. In April, they rose by the most in nearly four years, and economists say the impact of the Iran war and a potential El Niño weather pattern will only add to pressures into 2027.
“It’s going to be a challenging year,” said Ricky Volpe, an agribusiness professor at California Polytechnic State University who previously worked at the US Department of Agriculture’s Economic Research Service. “Food is going to become less affordable, and consumers should be prepared for it.”
The latest USDA food price outlook, published Friday, projected a 3.2% advance in grocery prices this year, while Volpe said he expects inflation more on the order of 4% to 4.5%.
Here’s my updated graph, using the midpoint of Volpe’s prediction.
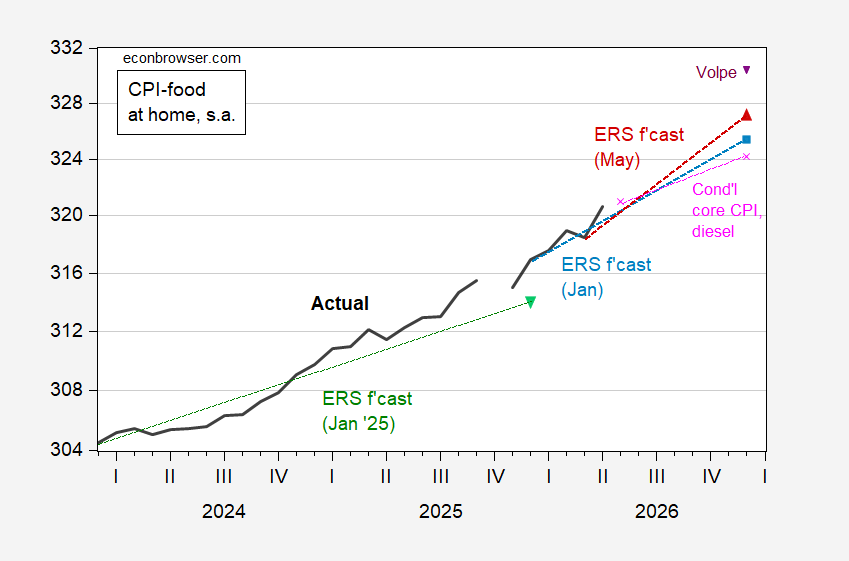
Figure 1: CPI – food at home (black), January 2025 ERS forecast (inverted green triangle), January 2026 forecast (light blue square), May 2026 forecast (red triangle), conditional forecast based on core CPI and May 2026 diesel price (pink x), R. Volpe prediction midpoint (inverted purple triangle), all on log scale. Source: BLS, ERS, Niquette & Rosenthal/Bloomberg, and author’s calculations.
The ERS forecasts for aggregate CPI components use ARIMA models, in my understanding (see documentation here). My conditional forecast uses a regression of the CPI food-at-home component on core CPI and diesel prices (2024M01-2026M04), and assumes for December 2026 2.6% core CPI y/y inflation (per the latest Survey of Professional Forecasters) and the average price of diesel prevailing in May 2026.
It’s not clear to me what variables Volpe uses in his 4%-4.5% estimate. In a journal article coauthored by Volpe (MacLachlan et al., Nature Comm., 2025).
Exogenous variables include ‘core’ CPI (excludes food and energy prices), transportation congestion, wholesale prices for finished consumer foods, and the principal components of US energy prices (energy principal component analysis index, PCAI), wages for relevant workers (wages PCAI), available funds for purchases (income PCAI), and the US money supply (money supply PCAI)…
As the article reports, an adaptive ARIMAX can upon a naive static specification I used in my forecast reported above (in terms of average forecasting errors).
Source link