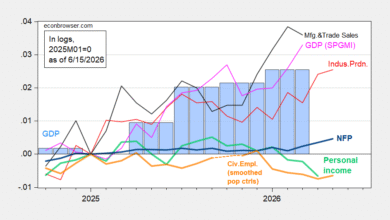
Here’s in the context of other alternative business cycle indicators:
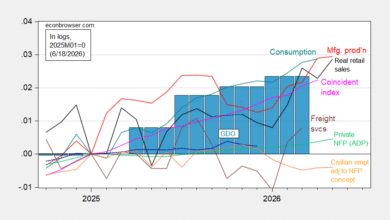
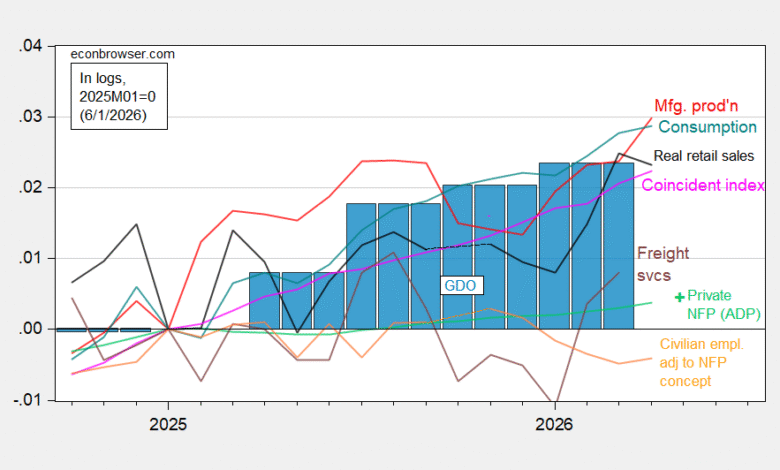
Figure 1: Civilian employment adjusted to NFP concept smoothed population controls (bold orange), manufacturing production (red), ADP private nonfarm payroll employment (light green), real retail sales, CPI deflated (black), freight services indexes (brown), and coincident index in Ch.2017$ (pink), GDO (blue bars), all log normalized to 2025M01=0. Source: BLS, ADP,via FRED, Philadelphia Fed, Bureau of Transportation Statistics, Federal Reserve via FRED, BEA 2026Q1 2nd release, and author’s calculations.
The freight transportation services index was revised down 1.2% for March, smaller amounts for preceding months. While it is rising from January 2026, it remains at a level lower than August levels.
BTS notes that (HP?) detrended index turning points often precede economic downturns, although visual inspection indicates index peaks of 1984, 1994, and 2012 did not presage a recession.
With respect to other transportation statistics, airline passenger enplacements through February remain close to January 2025 levels. VMT rose markedly in February — before decelerating in March, when gasoline prices rose sharply. We can take the statistics through February as cyclical indicators.
![]()
Figure 2: Air passenger enplanements – domestic (blue), – domestic and international (light blue), vehicle miles traveled (black), all in logs, 2025M01=0. Domestic enplanements seasonally adjusted by author using X-13 in logs, 2021M07-2026M02. Source: NHTSA, BTS, and author’s calculations.
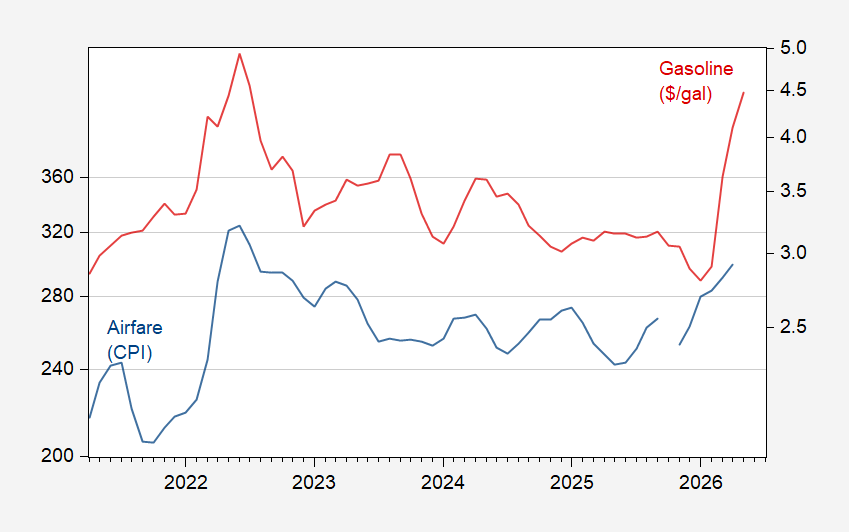
Figure 3: Airfare CPI component (blue, left log scale), gasoline $/gallon (red, right log scale). Gas price for May through 5/22. Source: BTS, EIA.
It’ll be interesting to see how enplanements respond to higher airline fares.
Source link