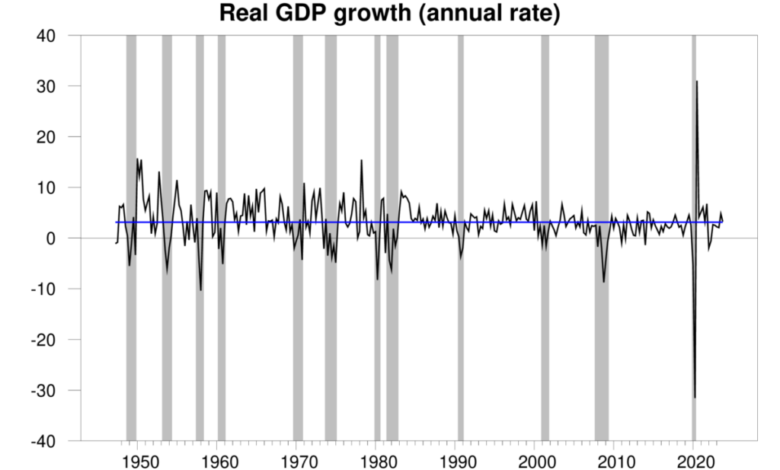
The Bureau of Economic Analysis announced today that seasonally adjusted U.S. real GDP grew at a 3.3% annual rate in the fourth quarter. That growth brings the level of GDP 3.1% above the value a year ago. Those numbers are right at the historical average GDP growth over the last 70 years of 3.1%, and well above the 2% average over the last 20 years. The year 2023 ended up far better than many people expected.
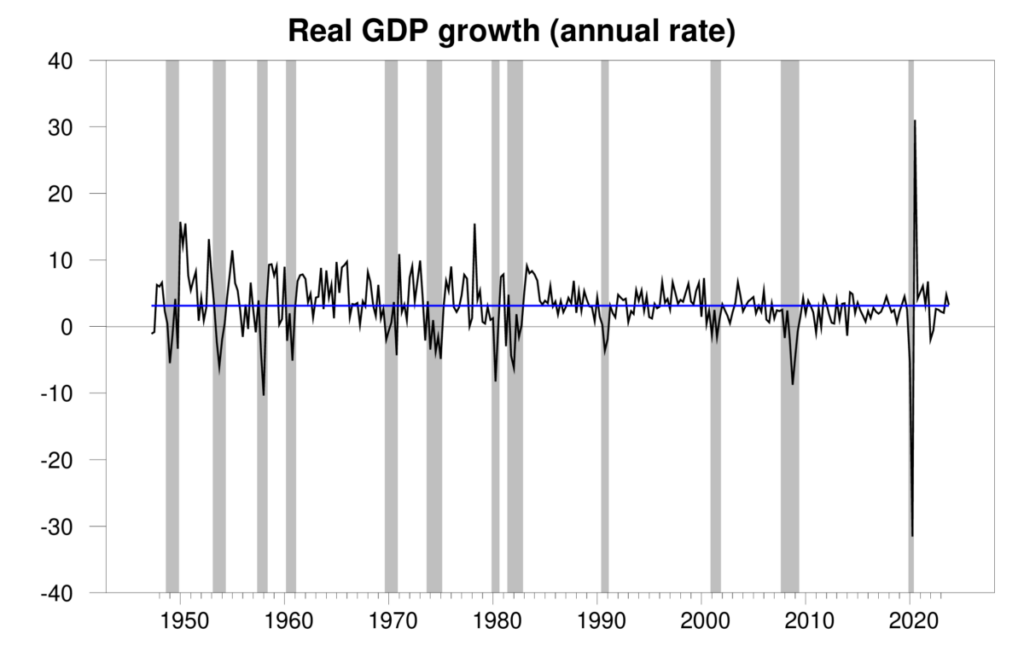
Real GDP growth at an annual rate, 1947:Q2-2023:Q4, with the historical average (3.1%) in blue. Calculated as 400 times the difference in the natural log of GDP from the previous quarter.
The strong growth of the last two quarters brought put the Econbrowser recession indicator index all the way down to 0.9%. The current U.S. expansion has now continued for 3-1/2 years, despite hitting a rough patch in the first half of 2022.
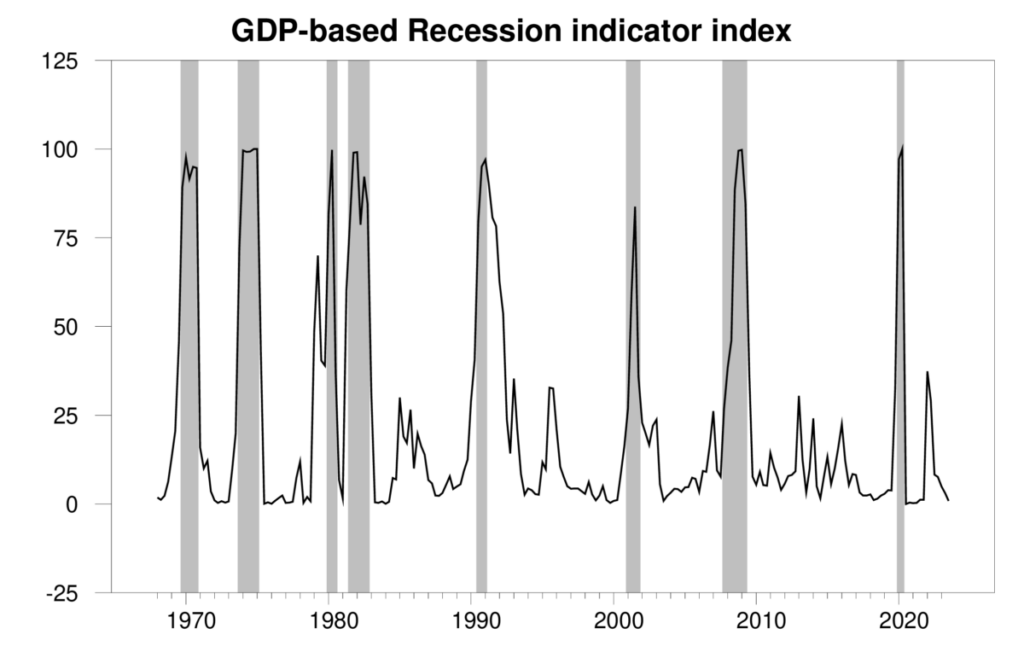
GDP-based recession indicator index. The plotted value for each date is based solely on the GDP numbers that were publicly available as of one quarter after the indicated date, with 2023:Q3 the last date shown on the graph. Shaded regions represent the NBER’s dates for recessions, which dates were not used in any way in constructing the index.
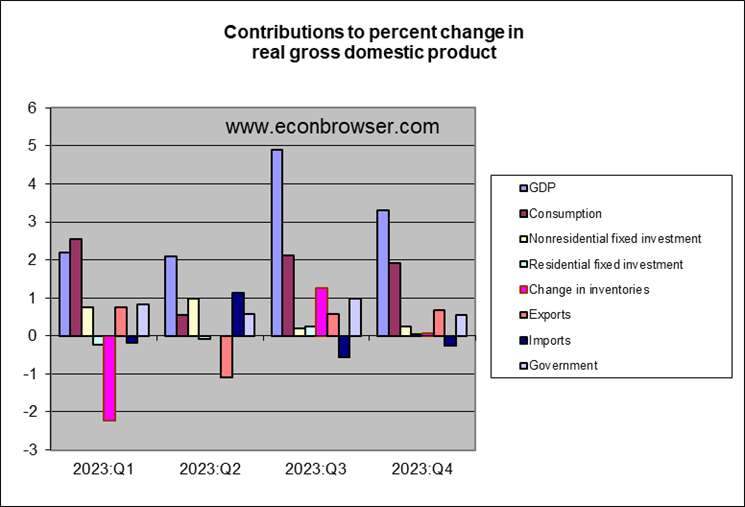
Inventory accumulation contributed the the strong Q3 numbers. By contrast, Q4 all comes from growth in final sales. Even residential fixed investment, which we might have expected to bear the brunt of the Fed’s tightening moves, continues to make a small positive contribution to GDP growth.
The year-over-year inflation rate as measured by the implicit PCE deflator is still above where the Fed wants it. But it’s been coming down, and if we were judging just by the 6-month or 3-month rate, we’d say mission accomplished.
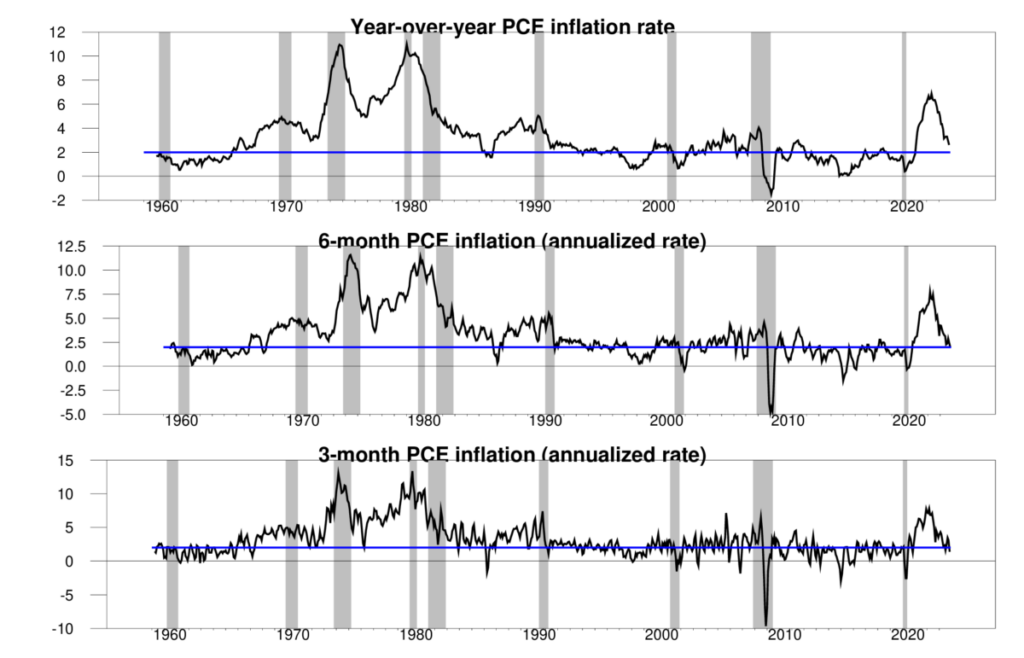
Three measures of the annual inflation rate. Top panel: 100 times the year-over-year change in the natural logarithm of the implicit price deflator on personal consumption expenditures. Middle panel: 200 times the 6-month change. Bottom panel: 400 times the 3-month change. Blue lines correspond to a 2% inflation rate.
So far, so good.
Source link

