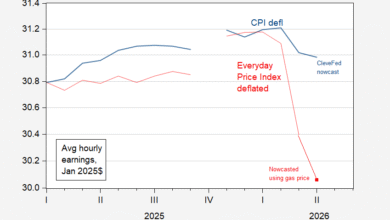
While (final) sentiment as measured by the University of Michigan survey remains surprisingly downbeat given observables, the decline needs to be put into context.
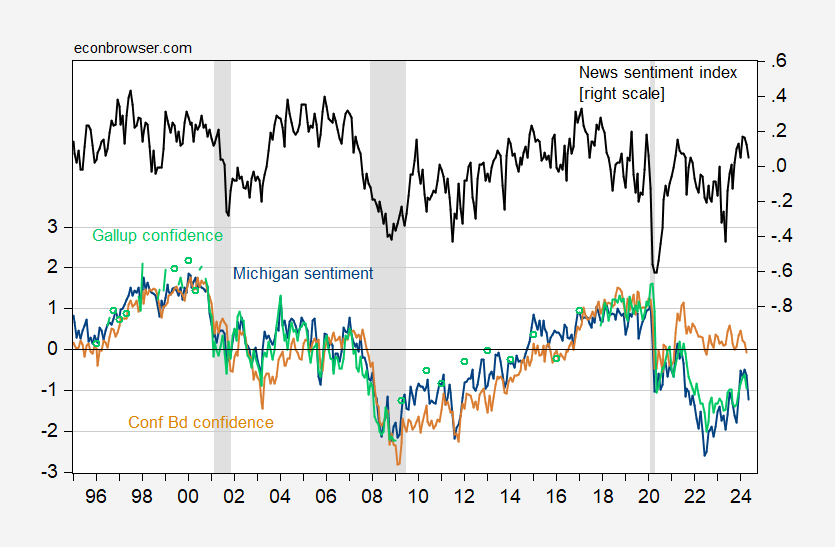
Figure 1: University of Michigan Consumer Sentiment (blue, left scale), Conference Board Consumer Confidence (tan, left scale), Gallup Economic Confidence (light green, left scale), all demeaned and normalized by standard deviation (for the displayed sample period); and Shapiro, Sudhof and Wilson (2020) Daily News Sentiment Index (black, right scale). Gallup May observation is the April 30 observation, etc. The News Index observation for May is through 5/19/2024. NBER defined peak-to-trough recession dates shaded gray. Source: U.Mich via FRED, Conference Board via Investing.com, Gallup, SF Fed, NBER, and author’s calculations.
It is interesting to think about who is accounting for this pessimism. For the Michigan survey for which we have a partisan breakdown, we can conclude that, relative to mid-2016, Republicans remain much more downbeat than either Democrats, or Independents. Why they are so downbeat is hard to say; it is hard to associate it with “news” as reflected in the SF Fed’s news sentiment index.
Source link