That’s Mr. Trump on inflation. Here’s the data:
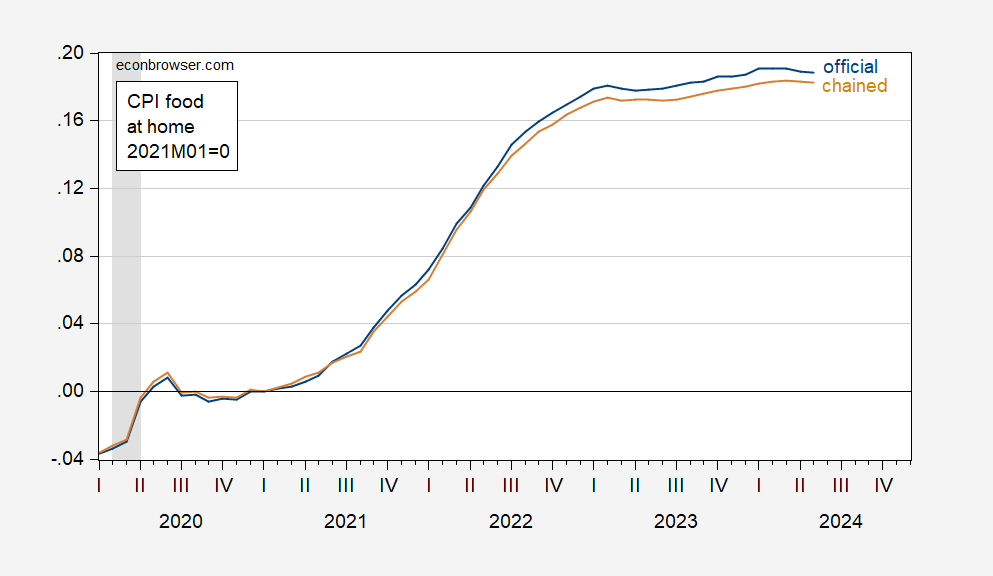
Figure 1: CPI for food at home (blue), chained (tan), both in logs, 2021M01=0. Chained CPI seasonally adjusted by author using X-13. NBER defined peak-to-trough recession dates shaded gray. Source: BLS and author’s calculations.
Above graph indicates the true number (admittedly, government statistics, instead of Trumpian anecdotes) is substantially below a quadrupling.
Source link