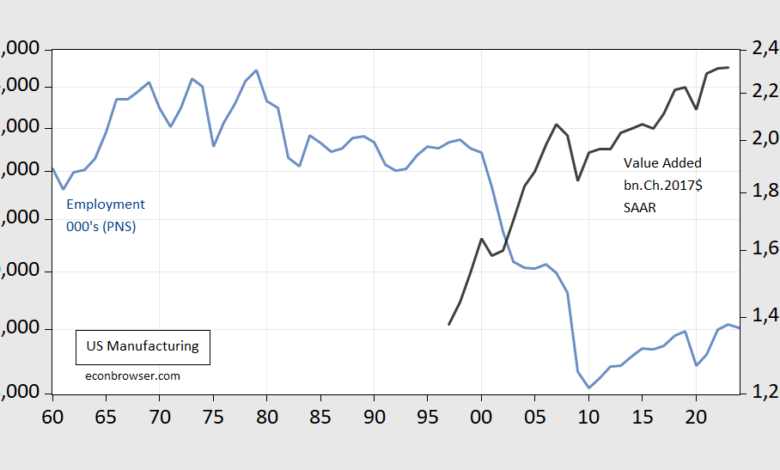
A reader sends me a missive with this line, and (among others) a picture of manufacturing employment. I reproduce (on an annual basis) this series back to 1960 in the figure below.
Employment in manufacturing did take a plunge in 2001. I didn’t know it was going to take quite the plunge it did, but I did see employment declining (then serving on CEA).
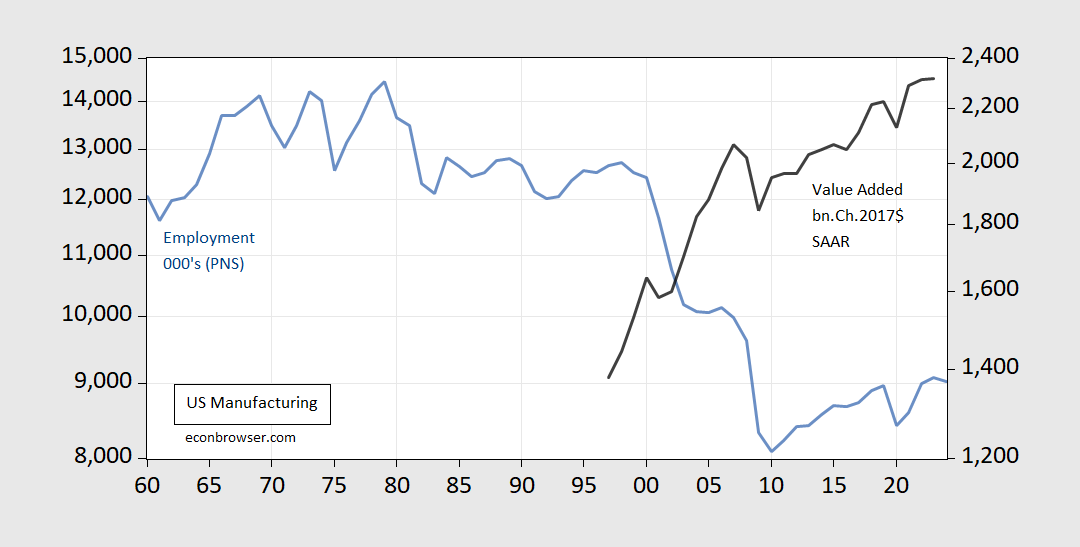
Figure 1: Manufacturing employment, production & nonsupervisory, 000’s (blue, left log scale), and manufacturing value added in bn.Ch.2017$ (black, right log scale). Source: BLS, BEA.
How can these trends in employment and value added do what they do? Well, it’s due to something called “productivity”. The same reason why employment in agricultural production (not processing, but farming etc.) is down yet value added output is up.
Just sayin’.
The reader also comments:
Just coincidentally and not at all related to any of this, China’s economy and rise as a military power soared about the turn of the century… or so we are supposed to believe.
The drop in manufacturing employment is not, in my view, unrelated to the entry of China into the world trading system. Comparative advantage would suggest reallocation should occur (gains from trade occur because of changes in consumption and production, after all). And there’s no doubt China has developed as a economic power and strategic competitor. On the second point, I wouldn’t be writing all those posts on PRC activities around Taiwan.
But good to keep things in mind. First, the US remains the world’s largest economy evaluated at market exchange rates.
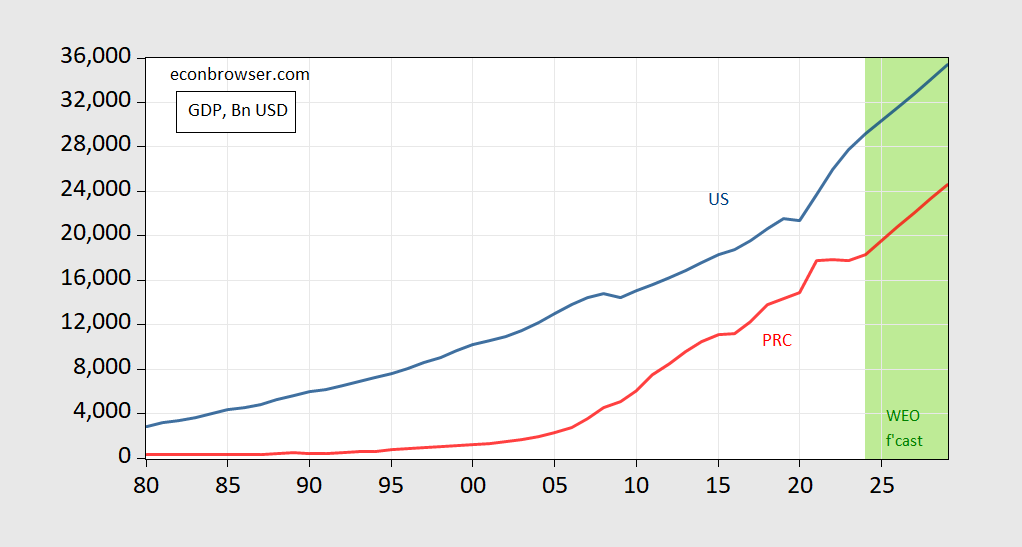
Figure 2: US GDP (blue), China (red), in bn. US$. Source: IMF WEO (October).
There is no longer a projected crossover, as had been projected in earlier years.
While PPP dollars would be more useful for comparing standards of living, market rates are more for considering economic power in the world economy, and ability to project influence. What about per capita in PPP International $?
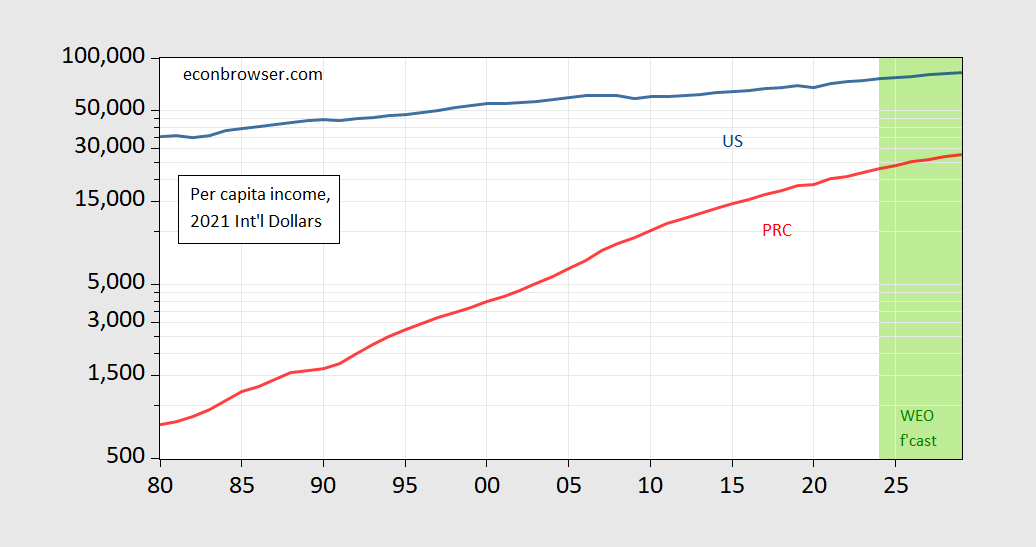
Figure 3: US GDP per capita (blue), China per capita (red), in bn. PPP 2021 International$ . Source: IMF WEO (October).
Source link