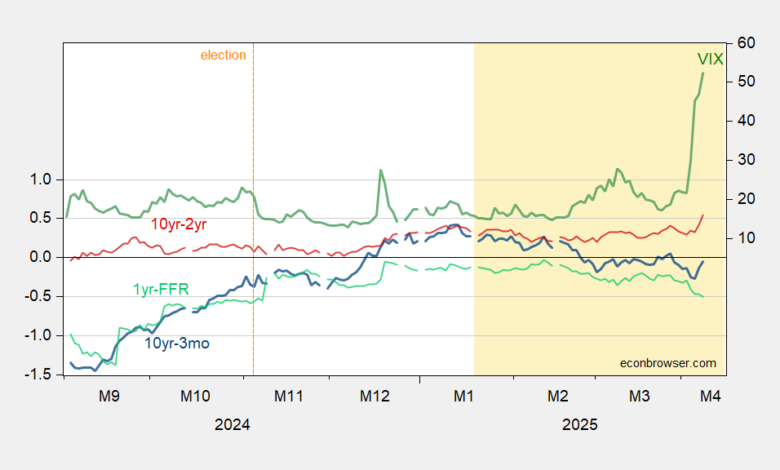
The time series, for 3m10s, 2s10s, as well as 1yr-FFR spread Miller (2019) identifies as max AUROC recession predictor at 1 month horizon.
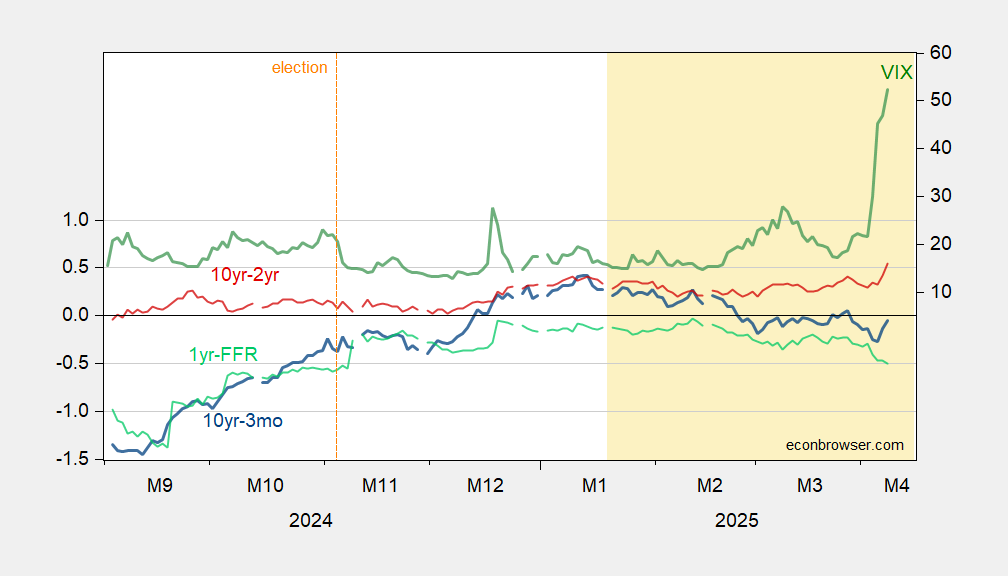
Figure 1: 10yr-3mo Treasury term spread (blue, left scale), 10yr-2yr Treasury term spread (red, left scale), 1yr-Fed funds (light green), all in %, VIX at close (green, right scale). Source: Treasury, CBOE via FRED.
Lee, Semenova, Tsekova, Reinecke/Bloomberg suggest an expanding budget deficit due to slowing anticipated growth driven by tariffs is pushing up yields; indeed the 5 year TIPS has risen by 15 bps over the last two days, as the nominal 5 year has risen 16 bps.
In any case, I find the evolution of yields at the 1 to 2 year maturities of key interest.
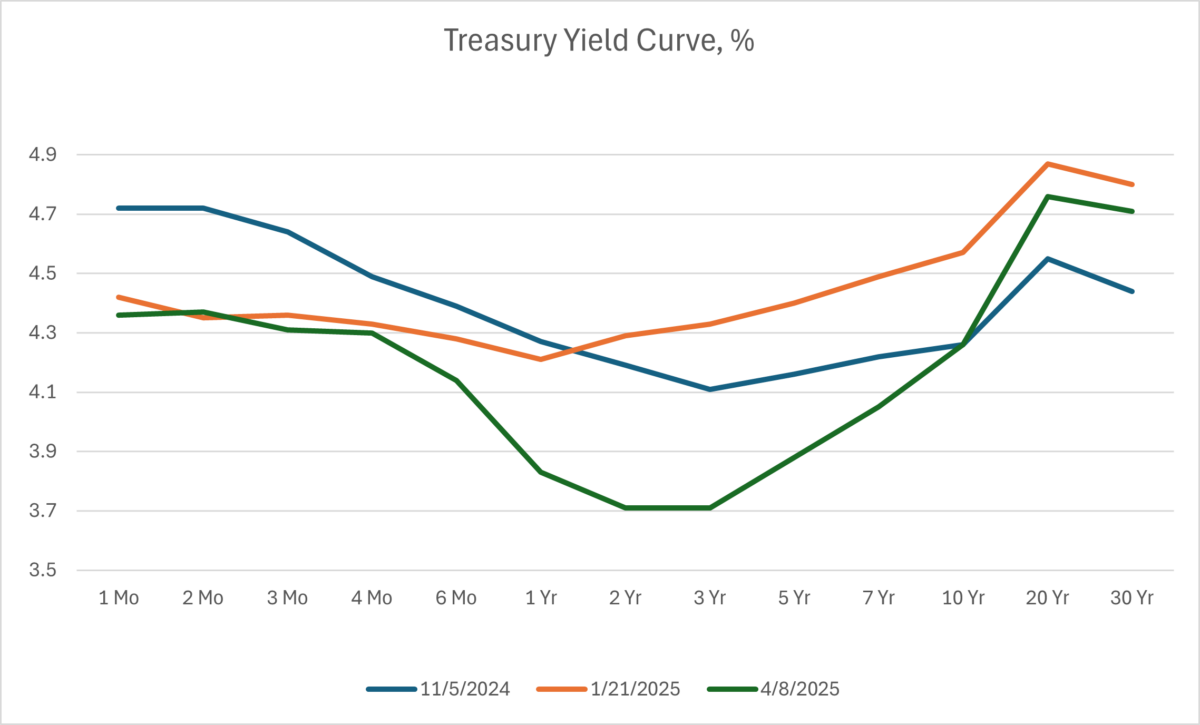
Figure 2: Treasury yield curves for 11/5 (blue), 1/21/2025 (orange), 4/8/2025 (green), all in %. Source: Treasury.
The inversion is deepening at the 6 month to 2 year part of the spectrum. The implied one year rate one year ahead is 3.59%, according to the expectations hypothesis.
Source link