Or at least the response of interest rates to deficits, controlling for investment and global saving.
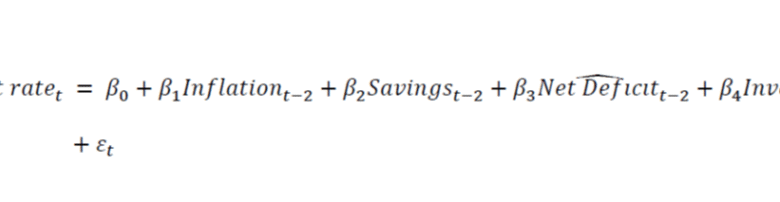
In Chapter 1 of Antoni’s dissertation, he estimates:
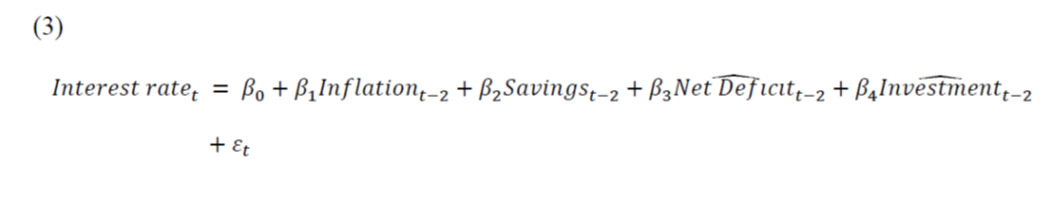
Where investment/GDP is instrumented with the change in the real wage, and savings is proxied by global saving to GNI, and the net deficit (usually called the Federal deficit) is instrumented with what Antoni calls the “gross deficit”, but in normal economics parlance is the primary deficit.
I along with John Kitchen have estimated similar equations, but we included Fed LSAPs etc.
Regarding the IV for investment/GDP, when I replicate the first stage regression, I get an adjusted R2 of -0.02 for the 1975-2016 period. Hardly a great IV. (By the way, there is not a single R2 reported in any table in the entire dissertation; actually no diagnostics at all. Readers will search in vain for an F-statistics).
Personal preference, I would’ve used CA/GNI for global savings, since the available saving is after investment and government spending (think of the national saving identity).
Antoni writes (pp.23-24):
Since the net deficit is explicitly calculated using the gross deficit, and since financing
costs are a relatively small portion of the net deficit, the net and gross deficit are highly
correlated. The gross deficit is strictly the product of how much Congress spends in a year and how much less Congress collects in taxes. Hence, there is no longer any reverse causality
between the deficit measure and the interest rate.
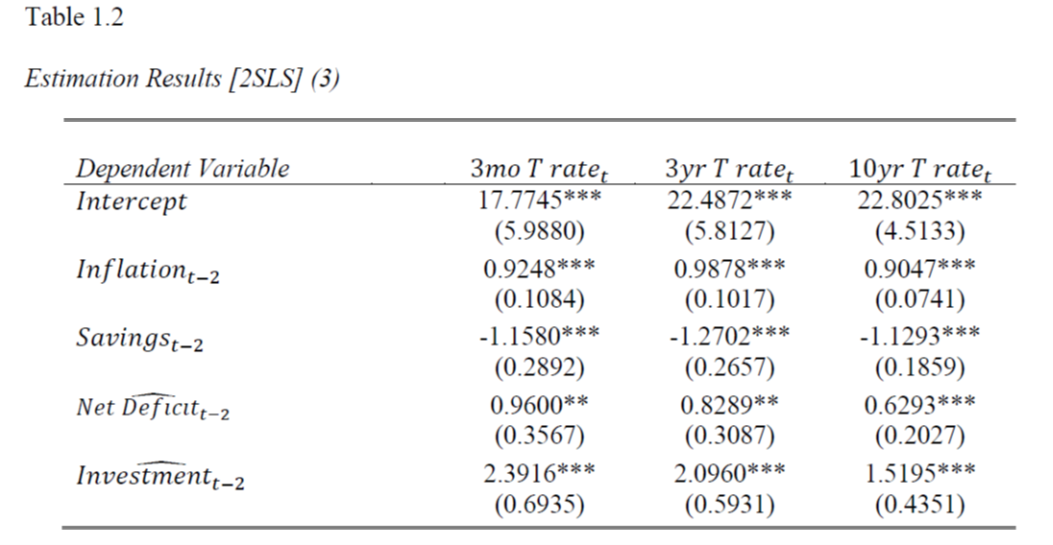
The coefficient on predicted net deficit is in the expected direction — a percentage point increase in the net deficit raises the 3 year Treasury yield 2 years later by about 0.8 percentage points.
Is the primary deficit a good instrument for the deficit? Over the sample that Antoni uses (1975 to 2016 because apparently of data limitations, although I could expand backward and forward myself, even restricting to 2020), it’s not too bad, in terms of R2 (Antoni doesn’t do an F-test or anything I can see). In terms of Granger causality, a 2 year lag seems okay for the 10 year rate, but not so much for the 3 year rate. The null of no causality from the 3 year rate to the LAGGED fitted budget deficit rejects at the 30% level in annual data, and 20% at the quarterly level. I guess this passes the IV criteria in some sense, but it should be noted that the no-causality null from fitted budget deficit to interest rate fails to be rejected at something like 80% levels.
Hence, I’d trust the 10 year rates more — although the results about no reverse causality are sensitive to sample (1967 to 2019, or even more importantly 1967 to 2024).
A final note: I can’t replicate Dr. Antoni’s results (I get a different sign on net deficit). In any case, I would wonder about the results even if I did, given that in my equation, on quarterly data, my DW is at 0.19, substantially less than the R2 of 0.56…
Source link