Primarily from the production function approach (discussion here).
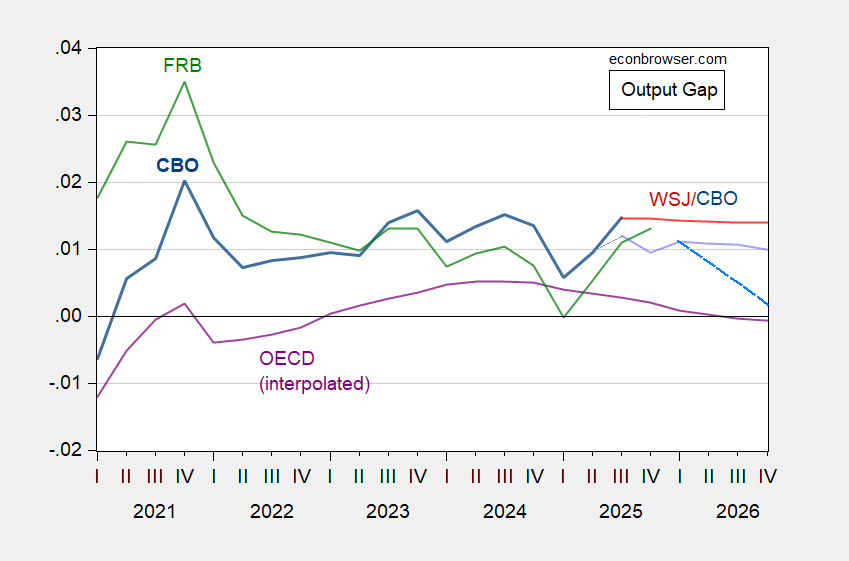
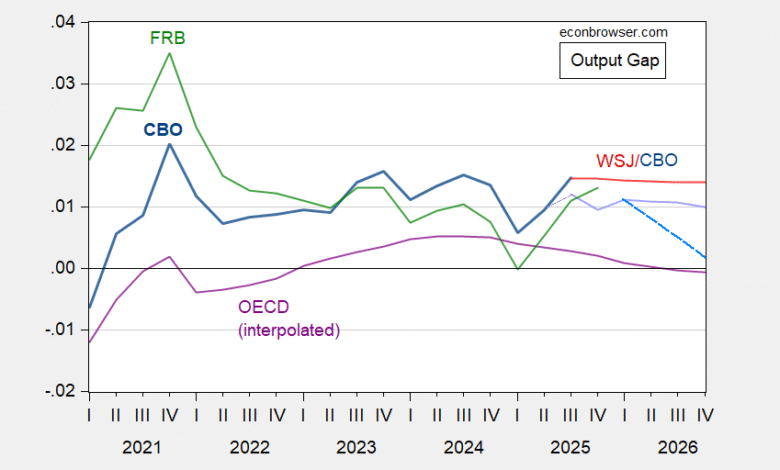
Figure 1: CBO output gap, calculated using latest BEA data and February 2026 estimate of potential GDP (dark blue), projected using February CBO GDP and potential GDP (lilac), CBO GDP omitting fiscal impulse from BBB (sky blue dashed blue), WSJ January survey mean and CBO potential GDP (red), FRB/US output gap (green), OECD December Economic Outlook estimate interpolated from annual data (purple), all as share of potential. Source: BEA 2025Q3 updated release, CBO February 2026 Budget and Economic Outlook, CBO, WSJ January survey, FRB via Atlanta Fed Taylor Rule Utility, OECD December 2024 Economic Outlook, and author’s calculations.
A caveat is worthwhile for the CBO output gap measures. Since GDP measures are revised, the first-release GDP implied output gap may well differ from final vintage (or even second release, as in the case of 2025Q3) implied output gap.
It is interesting to note that both the CBO based and FRB measures of the output gap are in excess of 1%, suggesting that the economy at the aggregate level is doing well. In contrast, the OECD’s forecasted measure of the output gap is 0% for 2026.
The CBO’s assessment of the fiscal stimulus emanating from the 2025 BBB is roughly 0.9 ppts of growth in 2026. In the absence of the BBB, the output gap would decline to about 0.2 ppts of GDP by end-2026. It’s against this backdrop that one might want to consider the correct level of the Fed funds target rate (after all, it’s not the change in GDP, but the output gap, that shows up in the Taylor Rule).
Source link