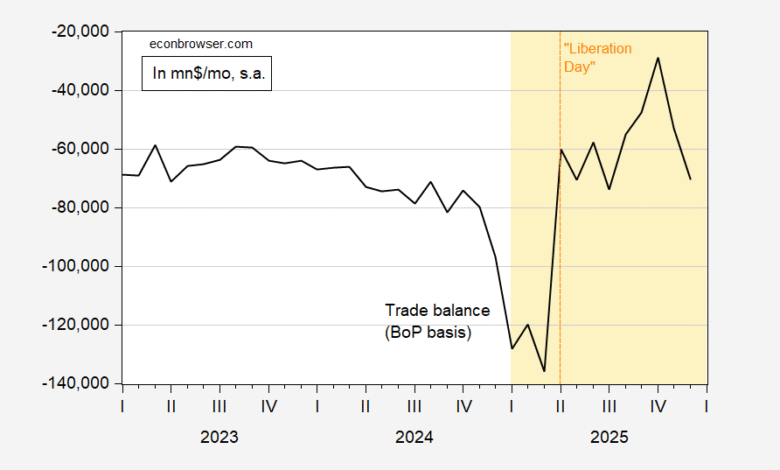
Total seasonally adjusted trade deficit averaged $75.1 mn, vs. 2024 $75.3 mn. The real goods trade deficit averaged $99.8 mn Ch.2017$ vs. 94.4 mn Ch.2017$. In other words, the real goods trade deficit increased (the same is true of the real goods ex-petroleum trade deficit).
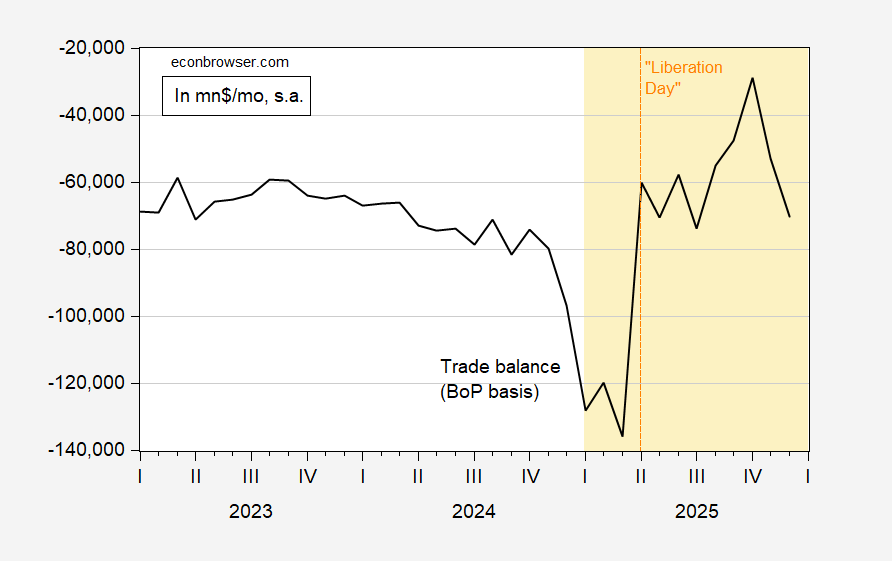
Figure 1: Trade balance, BoP basis, mn$ (black). Source: BEA.
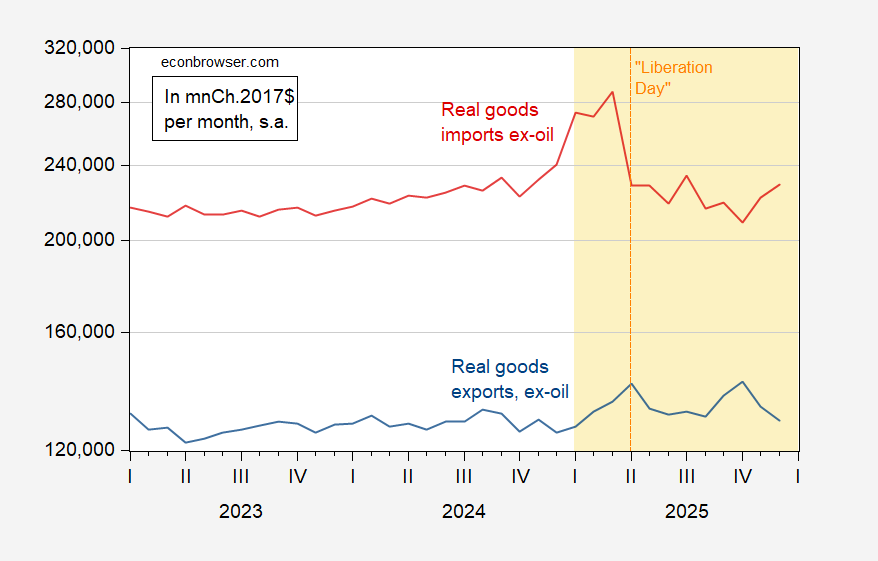
Figure 2: Real goods exports, ex-petroleum per month (blue), real goods imports, ex-petroleum per month (red), both in mnCh.2017$, s.a. Source: BEA.
If you thought macroeconomic aggregates (private saving vs. private investment, government budget balance, net income flows) determined primarily the trade balance, this outcome would not be very surprising.
Source link