From the IMF’s Asia Pacific Department, a blog “Asia’s Economic Resilience Is Being Tested by the Energy Shock”, two tables of interest: Oil and natural gas import dependence and intensity.
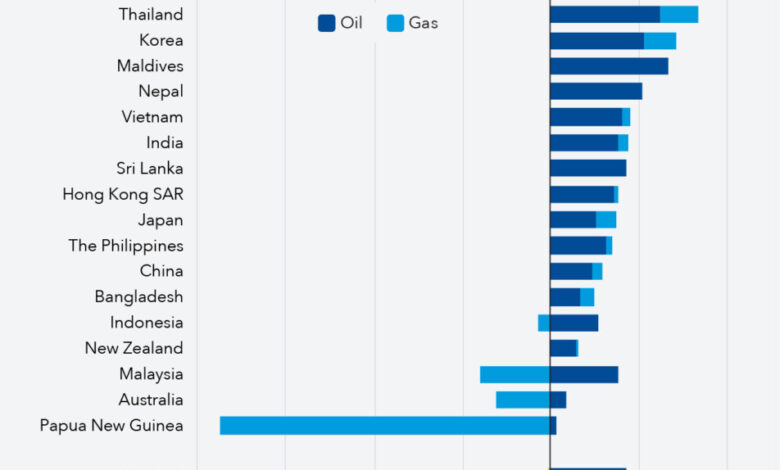
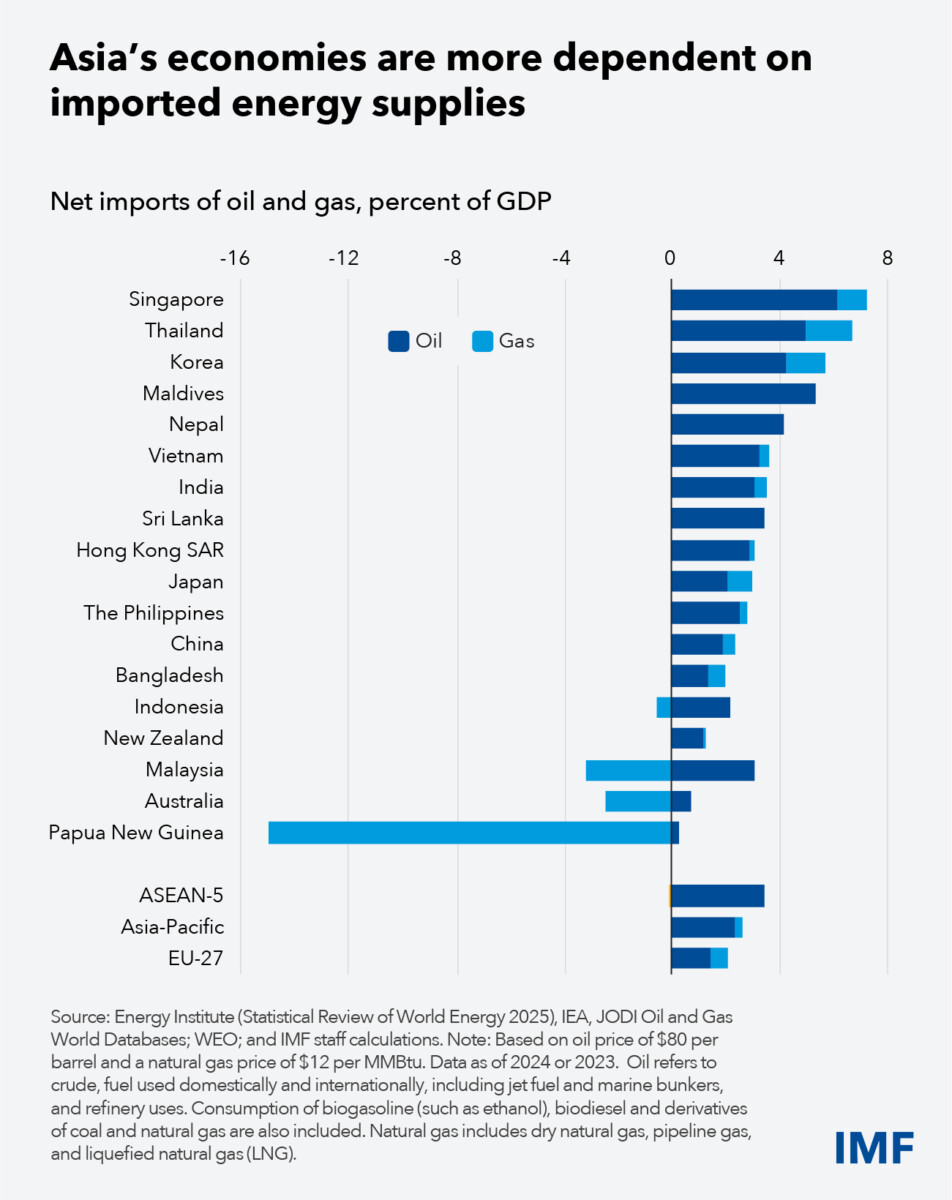
First, net imports of oil and gas as a share of GDP, ranked from top to bottom. Singapore, Thailand, and Korea are at the top, but India and Japan are not so far behind.
With Brent averaging $94/bbl in March, compared to $71 in February, a 32% increase. Brent inn April through 4/20 averaged $118/bbl, a 66.8% increase relative to pre-war. As long as physical crude prices aren’t too far above financial prices, then for Korea, the transfer of spending power to oil exporters would constitute 2.7 ppts of GDP (4 ppts x 0.67 = 2.7 ppts of GDP), assuming zero price elasticity and no downturn. Obviously, those are unsustainable assumptions, over the horizon of a year, particularly holding economic activity constant.
Now, even if a country were a net zero oil importer, it would still be affected by higher oil prices. That’s because oil prices are set in a global market, and so the price of domestic and internationally sourced oil would rise. The impact on the general price level would depend on the share of oil consumption in GDP.
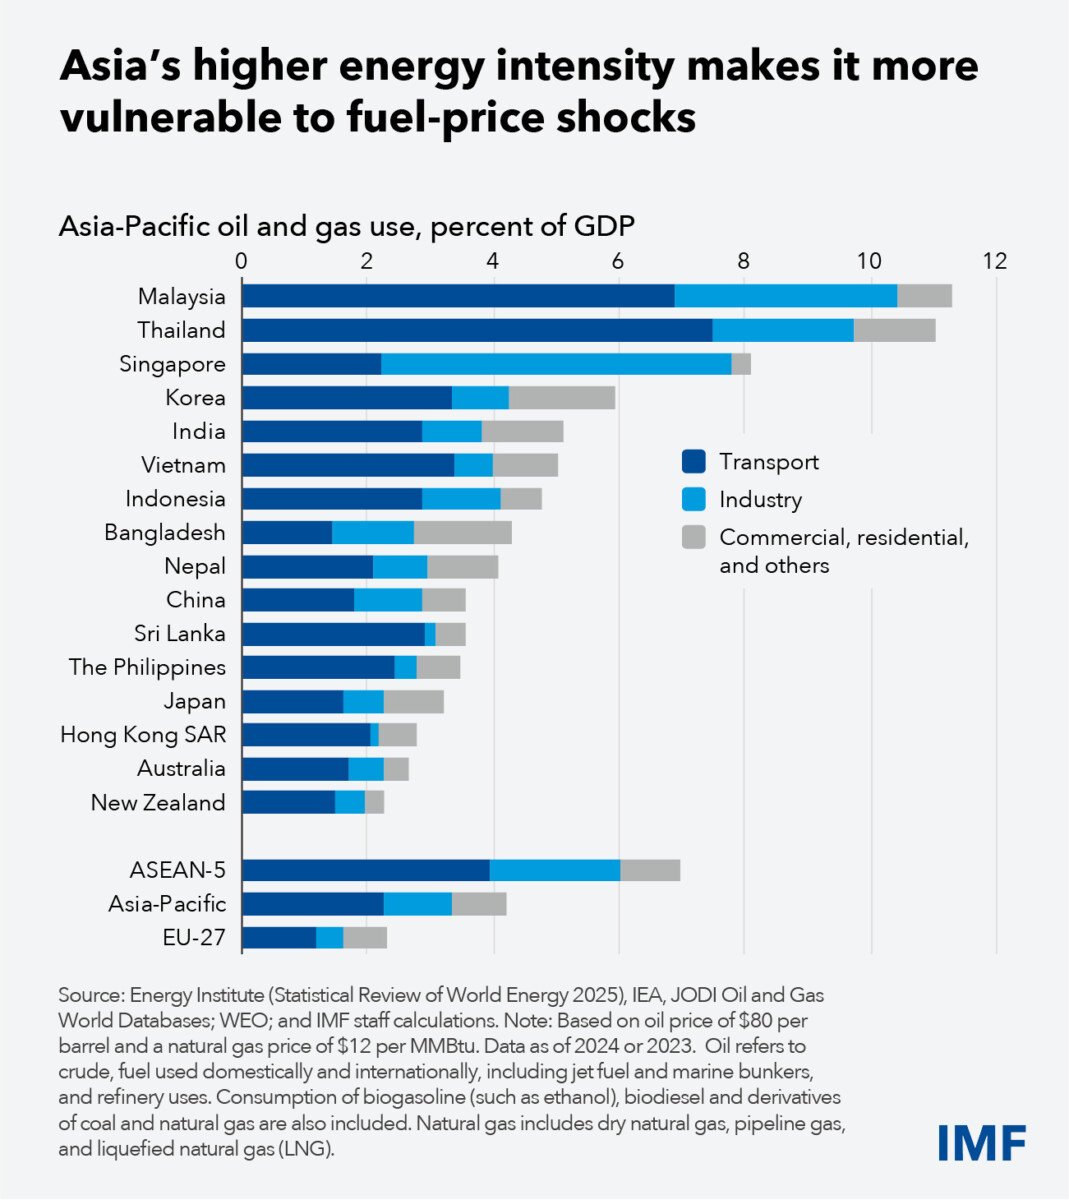
Hence, a country like the US — even with near balanced oil trade — would still experience a cost-push shock. In general, oil and gas dependence is about 4% in Asia-Pacific, about double that of Europe. Hence, the cost-push shock — holding all else constant — should be substantially larger than in Europe or North America.
Note that upward price pressure can be mitigated by subsidizing gasoline, etc. However, this would impose substantial fiscal costs (and delay adjustment to higher prices)
Much as been made of the difference between physical and paper (futures) prices for oil, particularly with respect to Asia, which is highly reliant on oil coming through the Strait of Hormuz. That means some countries may soon face actual shortages of crude oil and derivatives. Such an occurrence would have a qualitatively different effect from merely higher prices.
Can we look to the spread between dated Brent and June Brent as an indicator of shortages? I’m not sure, although Robin Brooks points out that the spread has shrunk in recent days.
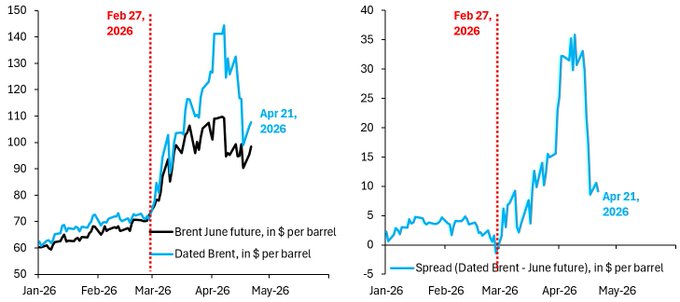
Given that oil cannot move rapidly, and most refineries in East Asia are designed to refine Gulf oil, it seems to me that actual shortages may actually occur; AJOT — coming from a logistics perspective — is in line with this view (as is Krugman). Robin Brooks on the other hand asserts that futures are accurately signaling market conditions, conditioned on imminent non-resolution/non-escalation.
The IMF projects a 1% reduction in growth relative to baseline in the “adverse” scenario. This scenario is described in the April WEO (page 7) thusly:
In the adverse scenario, (1) Oil prices are assumed to increase by 80 percent starting in the second quarter of 2026 relative to the January 2026 WEO Update baseline, before falling back to about 20 percent above baseline in 2027, with the increase dissipating in 2028 (corresponding to an average petroleum spot price index of about $100 per barrel in 2026 and about $75 in 2027). Gas prices increase for Europe and Asia by 160 percent in the second quarter relative to baseline, before also mostly unwinding in 2027, and food commodity prices increase by 2.5 percent. (2) One-year-ahead inflation expectations increase by as much as 50 basis points by 2027 in advanced economies and as much as 90 basis points in emerging markets excluding China. Inflation expectations are unchanged in China, as current low inflation makes this less of a risk than for other countries. (3) A risk-off episode increases corporate premiums in advanced economies and China by 50 basis points, while emerging markets excluding China experience a 100 basis point increase as well as a 50 basis point increase in sovereign spreads. The tightening in financial conditions fades in 2027. Given the large impact on inflation expectations, the monetary policy response assigns less weight to output stabilization than usually assumed.
What’re the IMF WEO forecasts (q4/q4 growth) under the reference scenario:
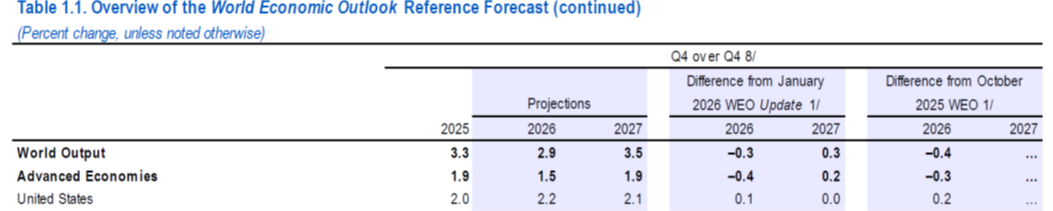

Notice that the US forecast for 2026 is faster relative to the January 2026 (pre-war) forecast, while China(Japan) is 0.6(0.5) ppts slower in 2026, and Emerging and Developing Asia overall is 0.3 ppts slower. For the “adverse” scenario, slice off a percentage point for Emerging and Developing Asia…
See Cave in the NYT for more discussion of the possible impacts.
I think most macroeconomists are pretty sanguine about the effects of the war on the US economy, give the tailwinds from AI investment. However, as an open economy macroeconomist, I do wonder how much spillover from the harder-hit regions of the world will force a reappraisal of America’s resilience. The US does not export much to East Asia, but we do export to countries which export to East Asia…
Source link