Debt issuance is rising, foreign official holdings of Treasurys are falling, the Fed is reducing holdings, and expected inflation is rising. How well do we predict rates?
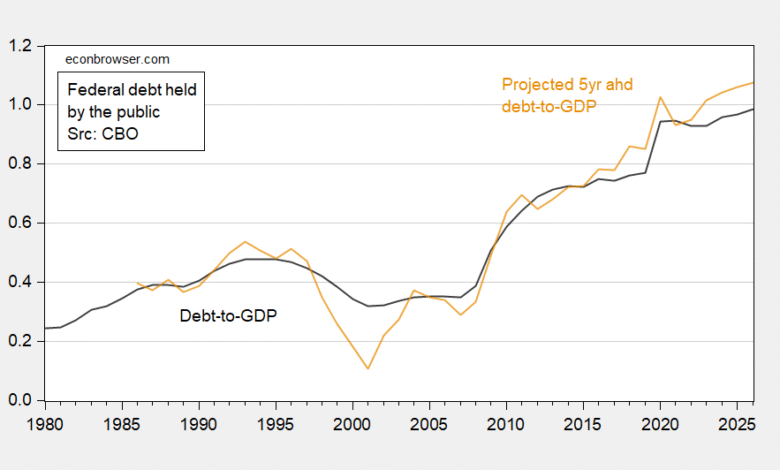
First, a picture of debt, and 5 year ahead projections of debt according to the CBO:
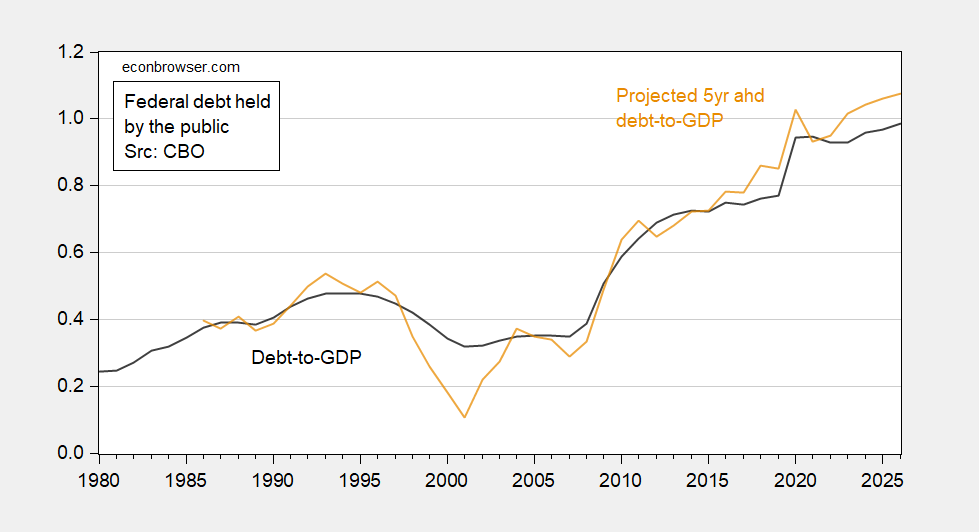
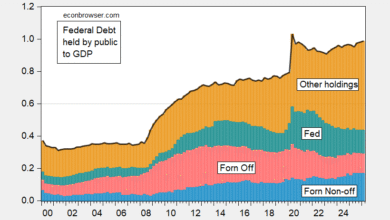
Figure 1: Debt to GDP (black) and projected debt-to-GDP 5 years ahead under current law (tan). Source: CBO, January or February Budget and Economic Outlook issues, and author’s calculations.
A simple correlation of debt-to-GDP with the Treasury rate (nominal or real) would show a counterintuitive (negative) correlation (column 1). Of course, since long term rates are a forward looking variable, expectations of the future debt level should also matter.
In order to estimate where interest rates should be, I follow Laubach (2009) in relating long term interest rates to expected inflation, debt, and anticipated debt.
Specifically:
it10yr = α0 + α1Et(πt10yr) + α2debtt + α3Et(debtt+2) + α4debt_fornt + α5debt_fedt + α6gapt
where Et(πt10yr) is survey expectations from the Livingston, Blue Chip and Survey of Professional Forecasters spliced together, debt_forn is debt held by the official foreign sector, debt_fed is debt held by the Federal Reserve Banks, and gap is the output gap. In all cases I add a covid dummy to account for the pandemic. Results of variants of this specification are shown in Table 1.
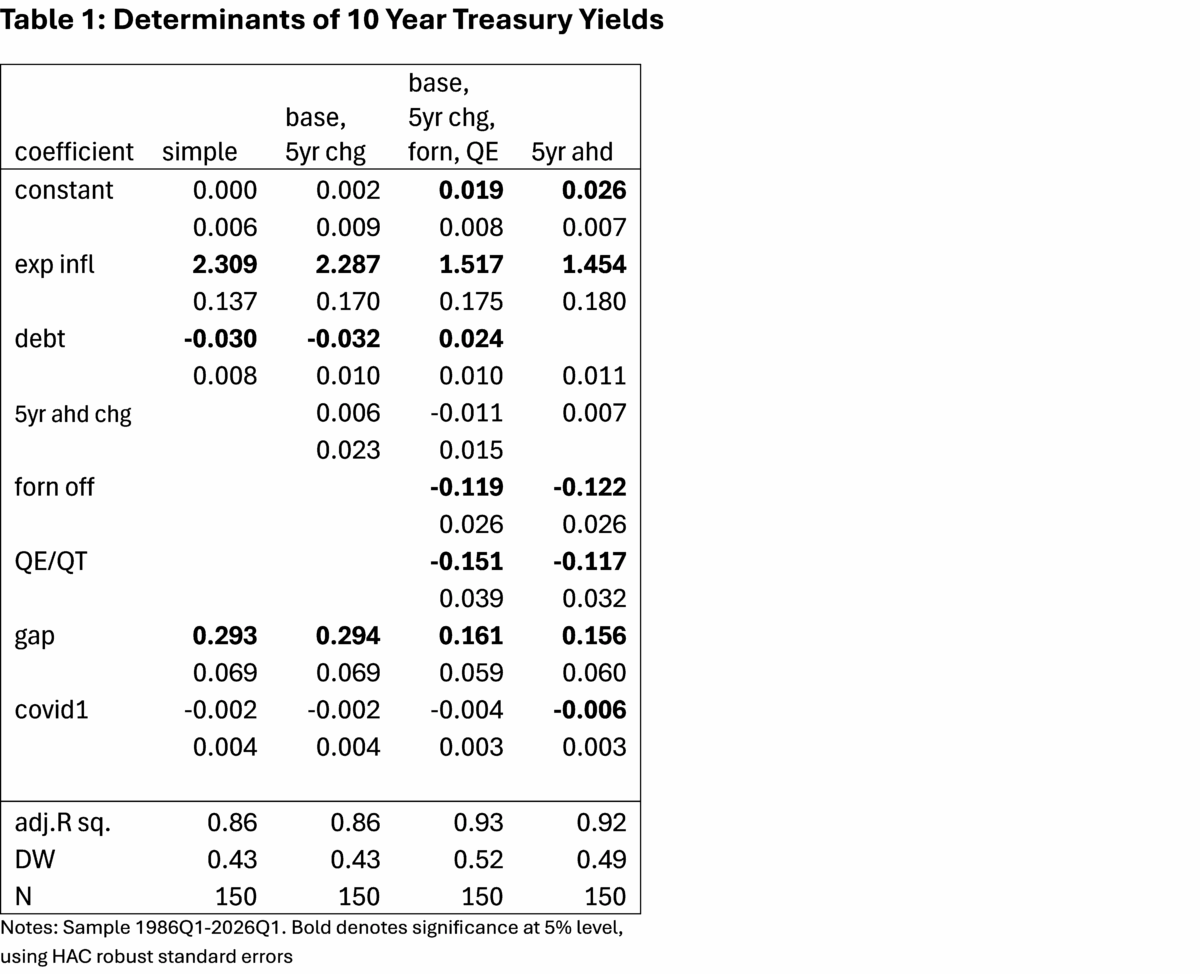
Column 1 illustrates the fact that a simple regression yields a counterintuitive (negative sign). Adding in the five year ahead change in the debt-to-GDP ratio doesn’t alter this debt coefficient in this sample (column (2)). Note however that this sample includes periods of extensive foreign official sector (central bank) purchases of Treasurys and Fed quantitative easing and tightening. Adding in these two variables as in Chinn and Frankel (2005) for the former, and Kitchen and Chinn (2012) for the latter, one obtains the results in column 3. Debt now has the correct sign: a one percentage point increase in the ratio induces a 0.024 percentage point increase in the Treasury yield. This is in line with estimates from Laubach, as well as those from Furceri et al. (2025), and Neveu and Schafer (2024). That being said, it’s interesting that the 5 year change in debt-to-GDP ratio doesn’t come in sigificantly. Nor does the implied five year ahead debt level (column 4). Those results are probably due to the measurement error inherent in using current law expected changes in the place of current policy changes.
Using the coefficients in column 3, I predict the Treasury rate for Q1.
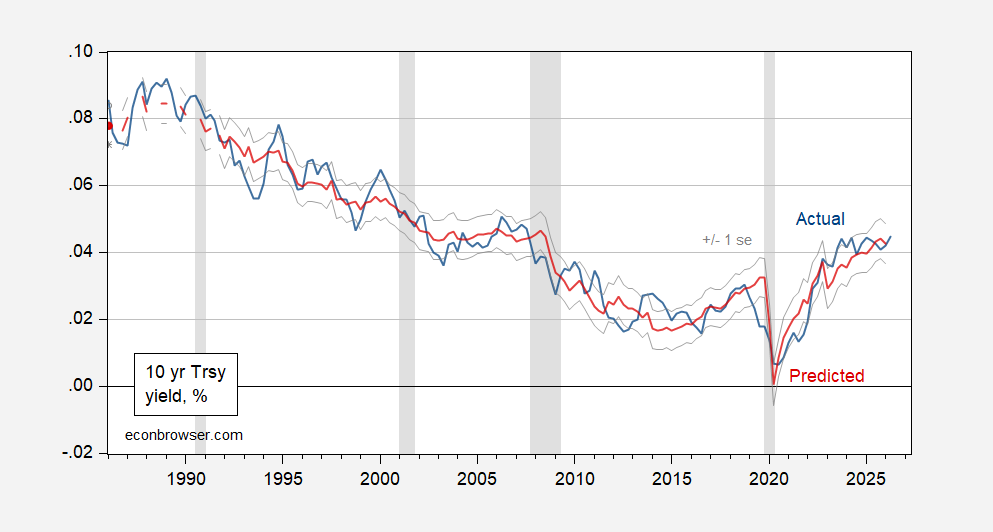
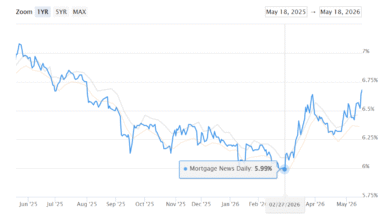
Figure 1: Ten year Treasury yields (blue), predicted using column 3 specification (red), +/- 1 std error band (light gray). 2026Q2 observation on actual is thru 5/19/2026. NBER defined peak-to-trough recession dates shaded gray. Source: Treasury via FRED, NBER, and author’s calculations.
In Q2, the prediction error is essentially zero. Part of this anomalous result arises because expected ten year inflation fell going from Q4 to Q1 (the survey period was in early February, before the War). Going into Q2, expected inflation jumped from 2.3% to 2.4%; that will push up predicted rates in Q2.
In all the above cases, the coefficient on expected (10 year) inflation is statistically significantly above the posited value of unity (at least, in a risk neutral case). Imposing a unit coefficient on expected inflation produces the results in Table 2.
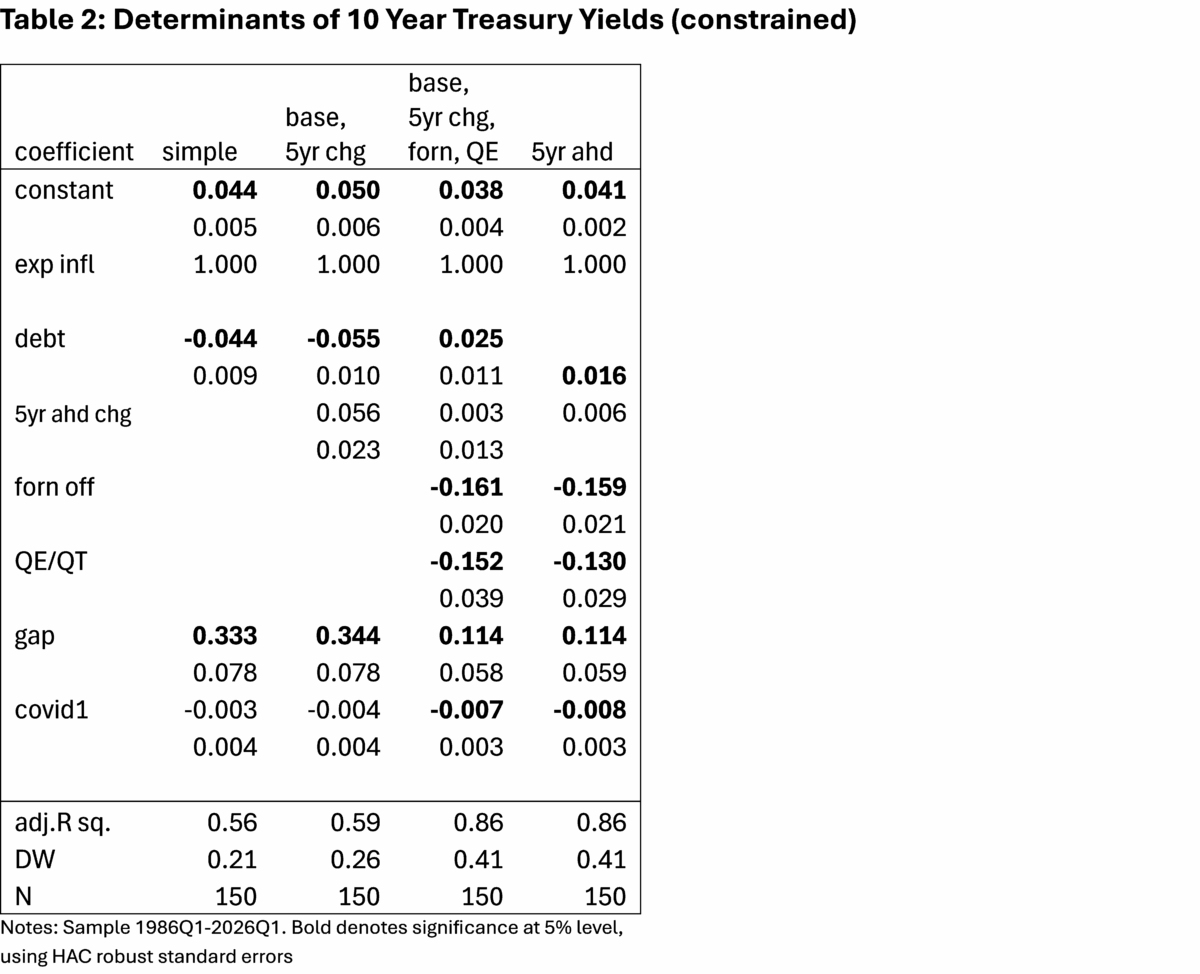
Using column 3 in Table 2, the real rate is overpredicted by about 30 bps in Q2, hardly a large error.
The foregoing analysis for 2026 relies on the expected year-end-debt and the 5 year ahead change in the expected debt-to-GDP ratio reported in the January 2026 Budget and Economic Outlook. With the ongoing war likely pushing up the debt level for year end, and the prospective 5 year change (and the expected 10 year inflation rate jumping from 2.3% to 2.4% in Q2), one can anticipate that the predicted Q2 interest rate will rise as well.
Source link