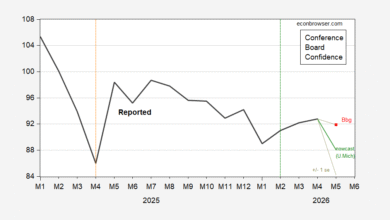
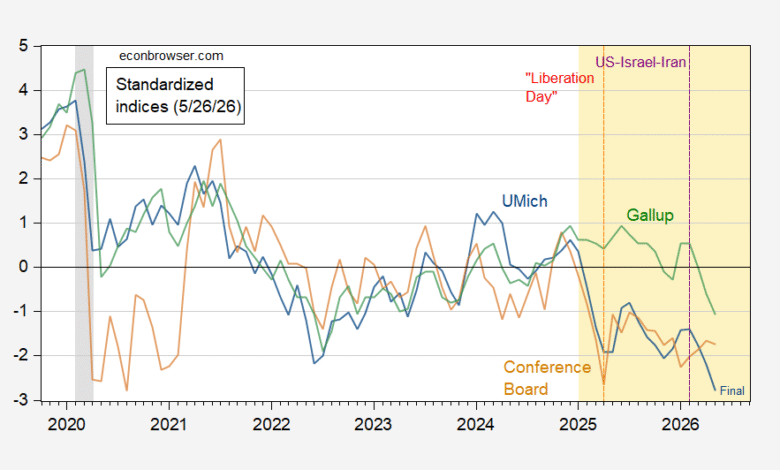
From Conference Board, May reading of 93.1 vs Bloomberg consensus of 91.9, on an upwardly revised April measure of 93.8 (up from prel. 92.8). Here’s the landscape of sentiment and confidence indicators.
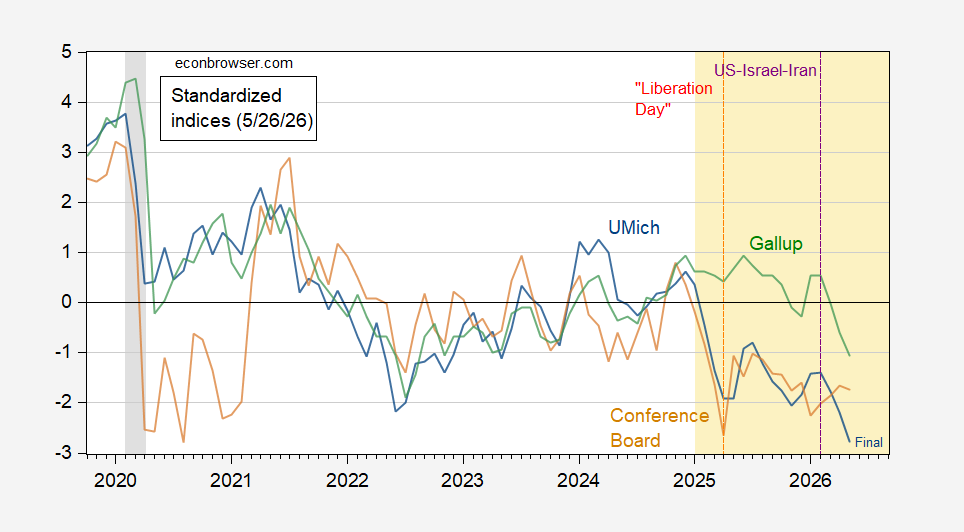
Figure 1: U.Michigan Economic Sentiment (blue), Conference Board Confidence Index (brown), Gallup Confidence (green), all demeaned and divided by standard deviation 2021M01-2025m02. Red dashed line at “Liberation Day” Source: U.Michigan, Gallup, Conference Board, and author’s calculations.
In order to summarize the overall sentiment/confidence level, given the Conference Board measures recent divergence from the other two, I create a composite measure by taking the first principle component of the three indices.
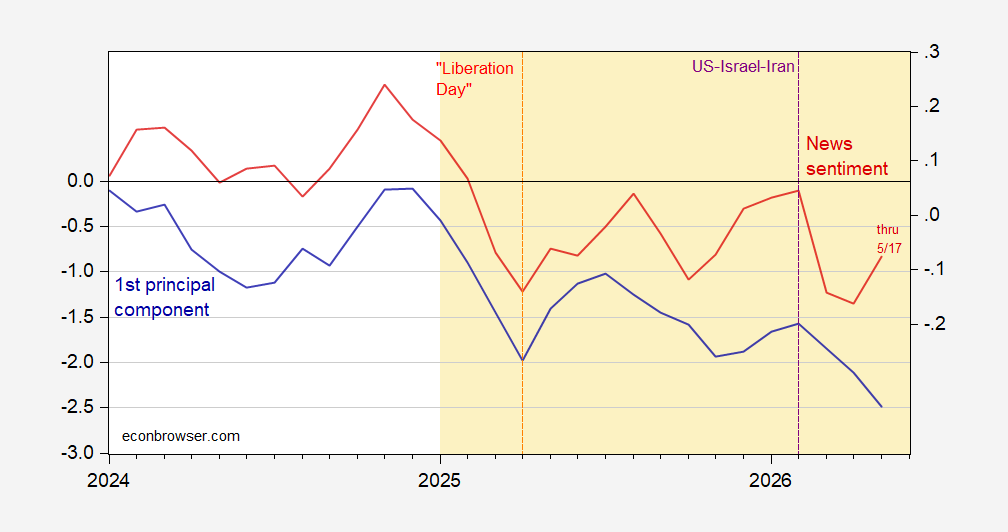
Figure 2: First principal component of U.Michigan Economic Sentiment, Conference Board Confidence Index, Gallup Confidence (blue, left scale), SSW SF Fed News Sentiment index (red, right scale). Weights for first principal component estimated 2018M01-2026M05. News Sentiment for May is using data through 5/17. Source: U.Michigan, Gallup, Conference Board, SF Fed, and author’s calculations.
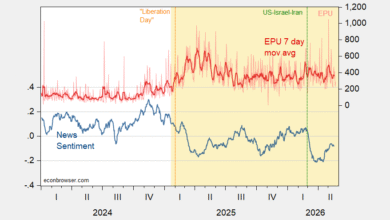
Overall sentiment/confidence is declining, even as text-based economic news declines (except for May, where only half of the month’s data is available).
Two other observations are noteworthy: (1) expected inflation is higher than that in the U. Michigan Survey; (2) Democratic and Independent views align closely; Republican stand apart.
On the first point:
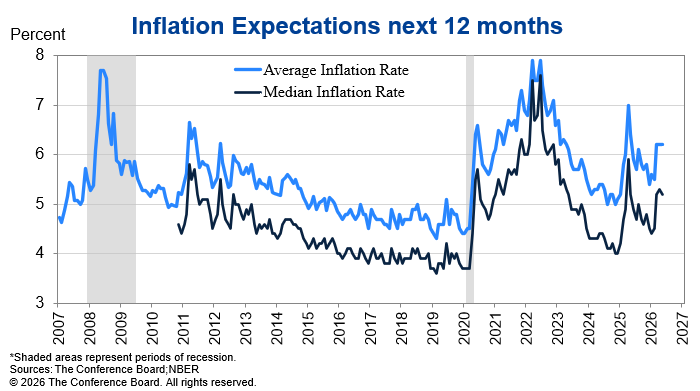
Source: Conference Board, accessed 5/26/2026.
A May mean reading of about 6.2% (eyeballing) contrasts with the U.Michigan Survey mean reading of 4.8%; even the median reading of 5.2% exceeds the Michigan mean reading…
On point 2:
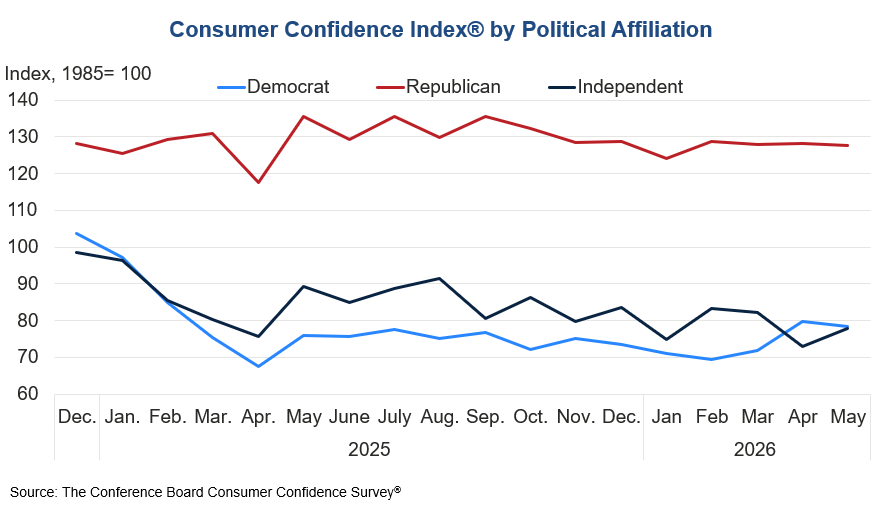
Source: Conference Board, accessed 5/26/2026.
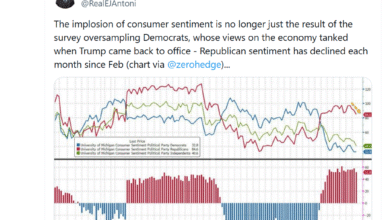
Republicans appear impervious to the bad economic news (as for instance measured by the SF News Sentiment Index). This finding contrasts with the results of the U. Michigan survey.
Source link