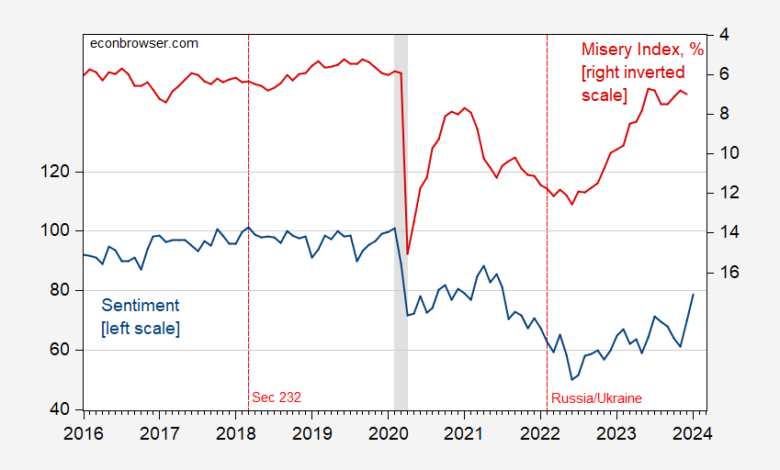
One of the mysteries of recent times has been the divergence between conditions (say, as measured by the Misery Index) and measured consumer sentiment. Figure 1 shows the U.Michigan sentiment index (FRED variable UMCSENT) vs. the sum of inflation and unemployment rates over the 2016-24M01 period. The jump in UMCSENT of 9 was about 2 standard deviations (for the 2016-23 period), on top of the nearly two deviation jump in December, and goes some way to redressing the gap.
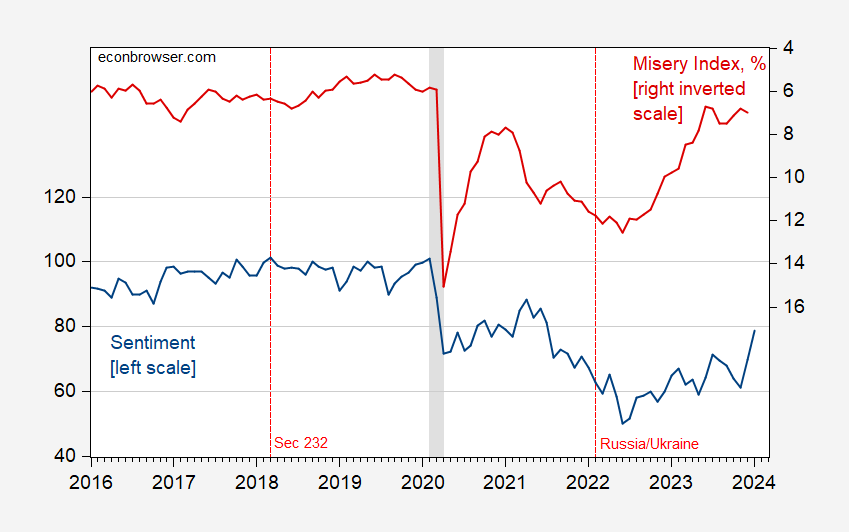
Figure 1: University of Michigan Consumer Sentiment ) (FRED series UMCSENT) (blue, left scale), and Misery Index, % (red, inverted right scale). NBER defined peak-to-trough recession dates shaded gray. Source: University of Michigan via FRED, BLS, NBER, and author’s calculations.
The Misery Index is inverted so higher values indicate lower misery. The Misery Index starts rising around mid-2022, relative to measured economic sentiment. Using a standard OLS regression of sentiment on misery over this period, residuals are significantly different from zero starting around mid-2022. Another way to put this is that as of December 2023, the predicted reading for UMCSENT is 88, while the actual was about 70.
One interesting stylized fact is that the correlation between inflation expectations from U.Michigan and UMCSENT is high, rising from zero 2016-2019 to 0.70 for 2020-2024M01. This suggests an outsize impact of inflation. Another way to look at this is to compare the standardized betas pre- and post-pandemic. The betas for unemployment rate and inflation are about equal pre-pandemic. From 2020M01 onward, the inflation beta coefficient is about 4 times that of the unemployment beta coefficient.
What about other indicators of sentiment? The SF Fed News Sentiment index is a text based indicator. In Figure 2, I show (demeaned, normalized by standard deviation) UMCSENT, the Conference Board’s Confidence Index, and the News Sentiment Index.
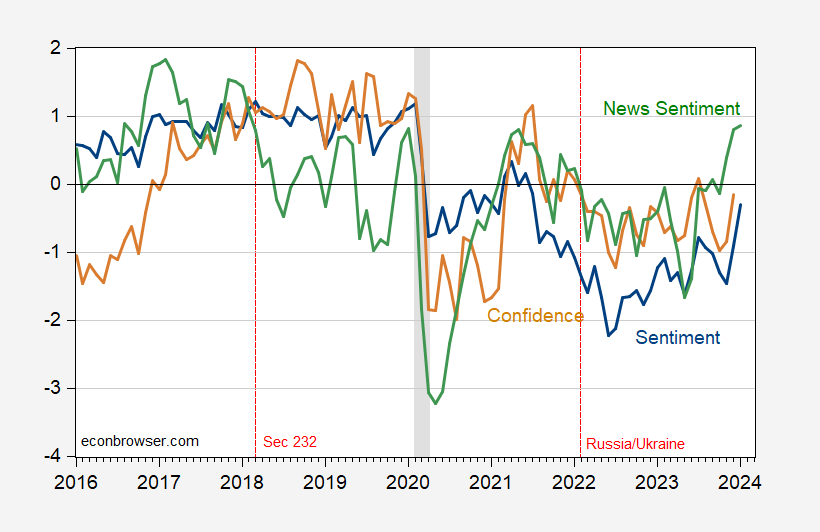
Figure 2: University of Michigan Consumer Sentiment (blue), Conference Board Consumer Confidence (tan), and Shapiro, Sudhof and Wilson (2020) Daily News Sentiment Index (green), all demeaned and normalized by standard deviation (for the displayed sample period). Michigan December observation is preliminary. The News Index observation for December is through 1/7/2024. NBER defined peak-to-trough recession dates shaded gray. Source: U.Mich via FRED, Conference Board via Investing.com, SF Fed, NBER, and author’s calculations.
While the Michigan Sentiment index tracks the news index, there is a partisan divide. Over this sample period, the adjusted R2 of a regression of Democratic sentiment on the news index yields is about 0.35. The analogous regression using Republican sentiment has an adjusted R2 of 0.04. (A regression of the Confidence Board’s Index of Consumer Confidence on news sentiment has an adjusted R2 of 0.19). So essentially none of the Republican sentiment is explained statistically by text-based news sentiment. This is consistent with either Republican sentiment being impervious to economic information, or Republicans interpret economic news in a different fashion than Democrats (or Independents, for whom the adjusted R2 is 0.19).
More on the partisan divide in sentiment, here.
Source link