On the back of yesterday’s GDP release (discussed by Jim), real personal consumption continues to rise, beating consensus (+0.5% m/m vs. +0.3% Bloomberg), while nominal personal income hits consensus at +0.3%. Here’s the picture of some key indicators followed by the NBER Business Cycle Dating Committee, plus monthly GDP.
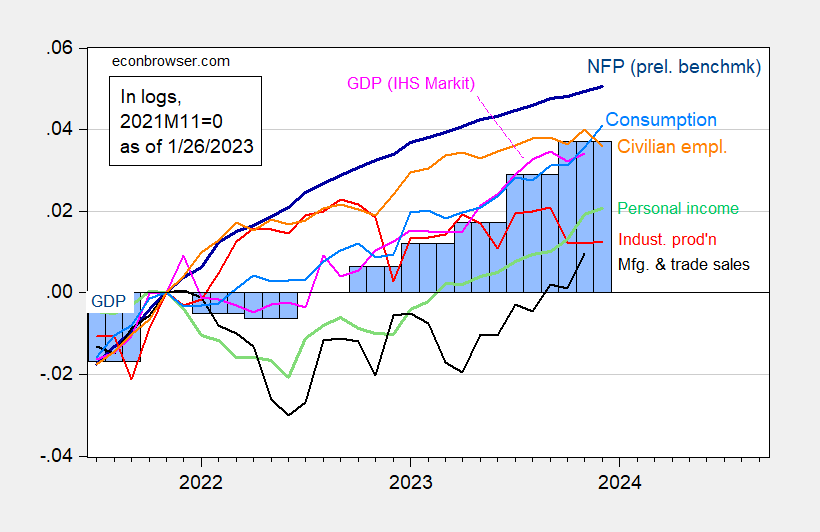
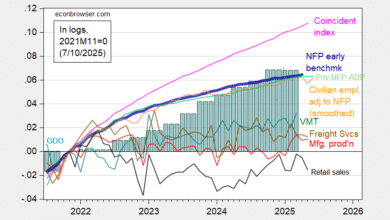
Figure 1: Nonfarm Payroll employment incorporating preliminary benchmark (bold dark blue), implied level using Bloomberg consensus as of 1/3 (blue +), civilian employment (orange), industrial production (red), personal income excluding current transfers in Ch.2017$ (bold green), manufacturing and trade sales in Ch.2017$ (black), consumption in Ch.2017$ (light blue), and monthly GDP in Ch.2017$ (pink), GDP, 2nd release (blue bars), all log normalized to 2021M11=0. Source: BLS via FRED, BLS preliminary benchmark, Federal Reserve, BEA 2023Q3 2nd release incorporating comprehensive revisions, S&P Global/IHS Markit (nee Macroeconomic Advisers, IHS Markit) (1/2/2024 release), and author’s calculations.
Aside from industrial production, it’s hard to see the downturn in data reported thus far.
For data pertaining to the new year, the Lewis-Mertens-Stock NY Fed Weekly Economic Index (WEI) for the week ending January 20, the reading stands at 1.90%. The Baumeister-Leiva-Leon-Sims Weekly Economic Conditions Index reads -0.10%. If trend US GDP is 2%, then this implies 1.90% growth as well.
Source link